Geolocation - Foot Traffic
The Foot traffic algorithm analyzes your AOIs to count devices observed within your AOI over a period of time. In general, it allows users to monitor levels of activity using device counts as a proxy, at AOIs such as factories (worker activity), retail & commercial locations (shopper activity), and other generic locations.
Foot traffic provides built-in data science for advanced filtering and normalization that allows you to identify activity trends and anomalies more accurately.
Using the Foot traffic algorithm
- Draw your AOIs as usual
- Select the Foot traffic algorithm
- Set a date range for analysis
- (Optional) Tweak the parameters as needed
- Click Run!

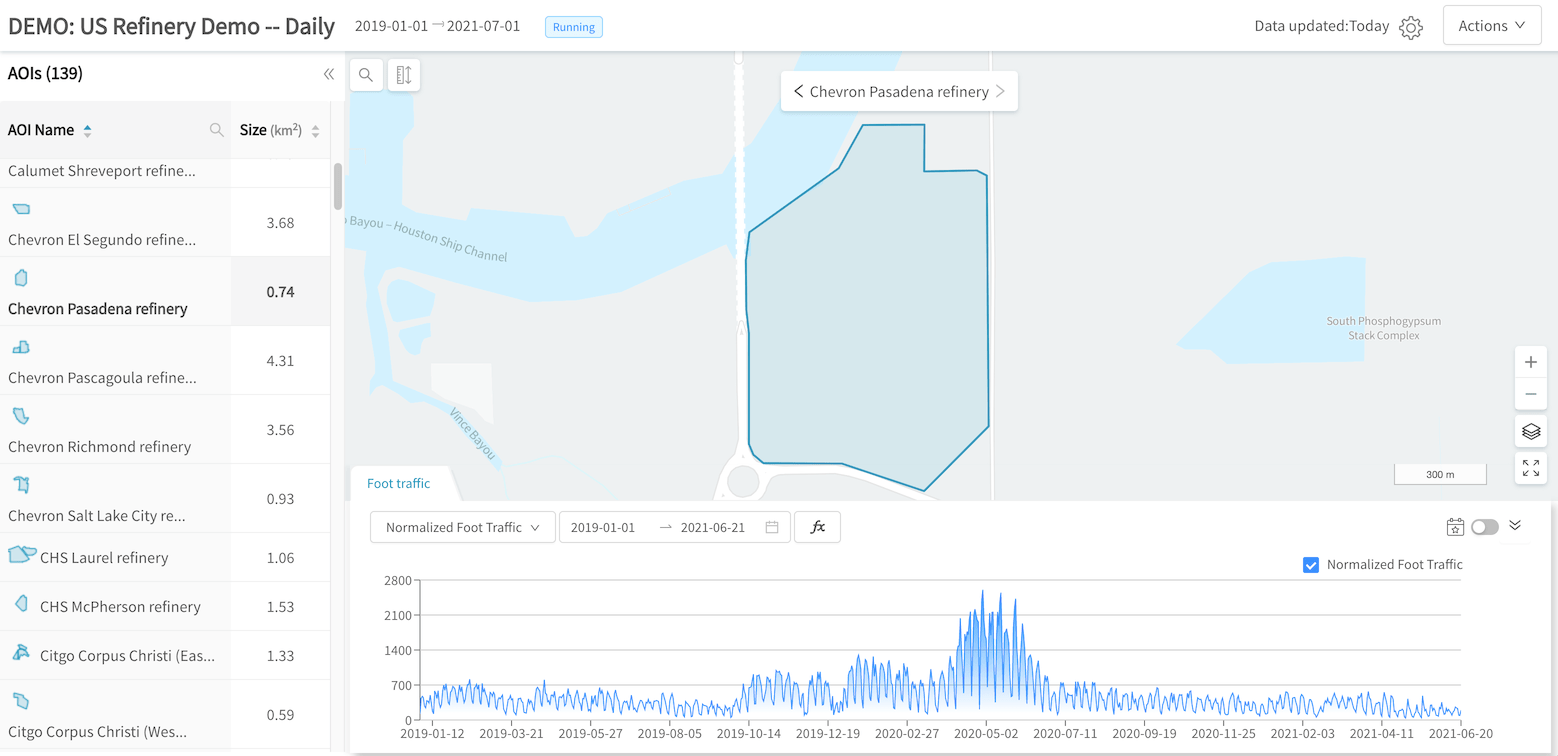
Foot Traffic produces a time series of device counts at your AOIs
Normalization & Stable User Filtering
Raw geolocation data contains various sources of noise that can distort results if not corrected. A significant driver of this are panel shifts where the number of devices present in the raw data changes dramatically, due to the addition / removal of mobile apps to the raw data panel, and changes in the number of devices with such apps installed.
There are 2 primary techniques employed by Foot traffic to correct for such issues:
- Normalization: normalize device counts in your AOIs with device counts in the broader surrounding areas ("proximity zone"), with the expectation that broad panel shifts are similar in both your AOI and the proximity zone. Additionally, normalization uses the approximate population of the proximity zone to produce a "true" population estimate of the number of people at your AOIs.
- Stable user filtering: filter for and count only devices that are frequently active, thus discarding lower-quality data from devices that only provide data sporadically.
Enabling normalization (on by default) will add an additional normalized count time series to your results, in addition to the raw count time series.
If both normalization and stable user filtering are enabled, the stable user filtering will be applied to both your AOIs and their corresponding proximity zones.
Heatmap
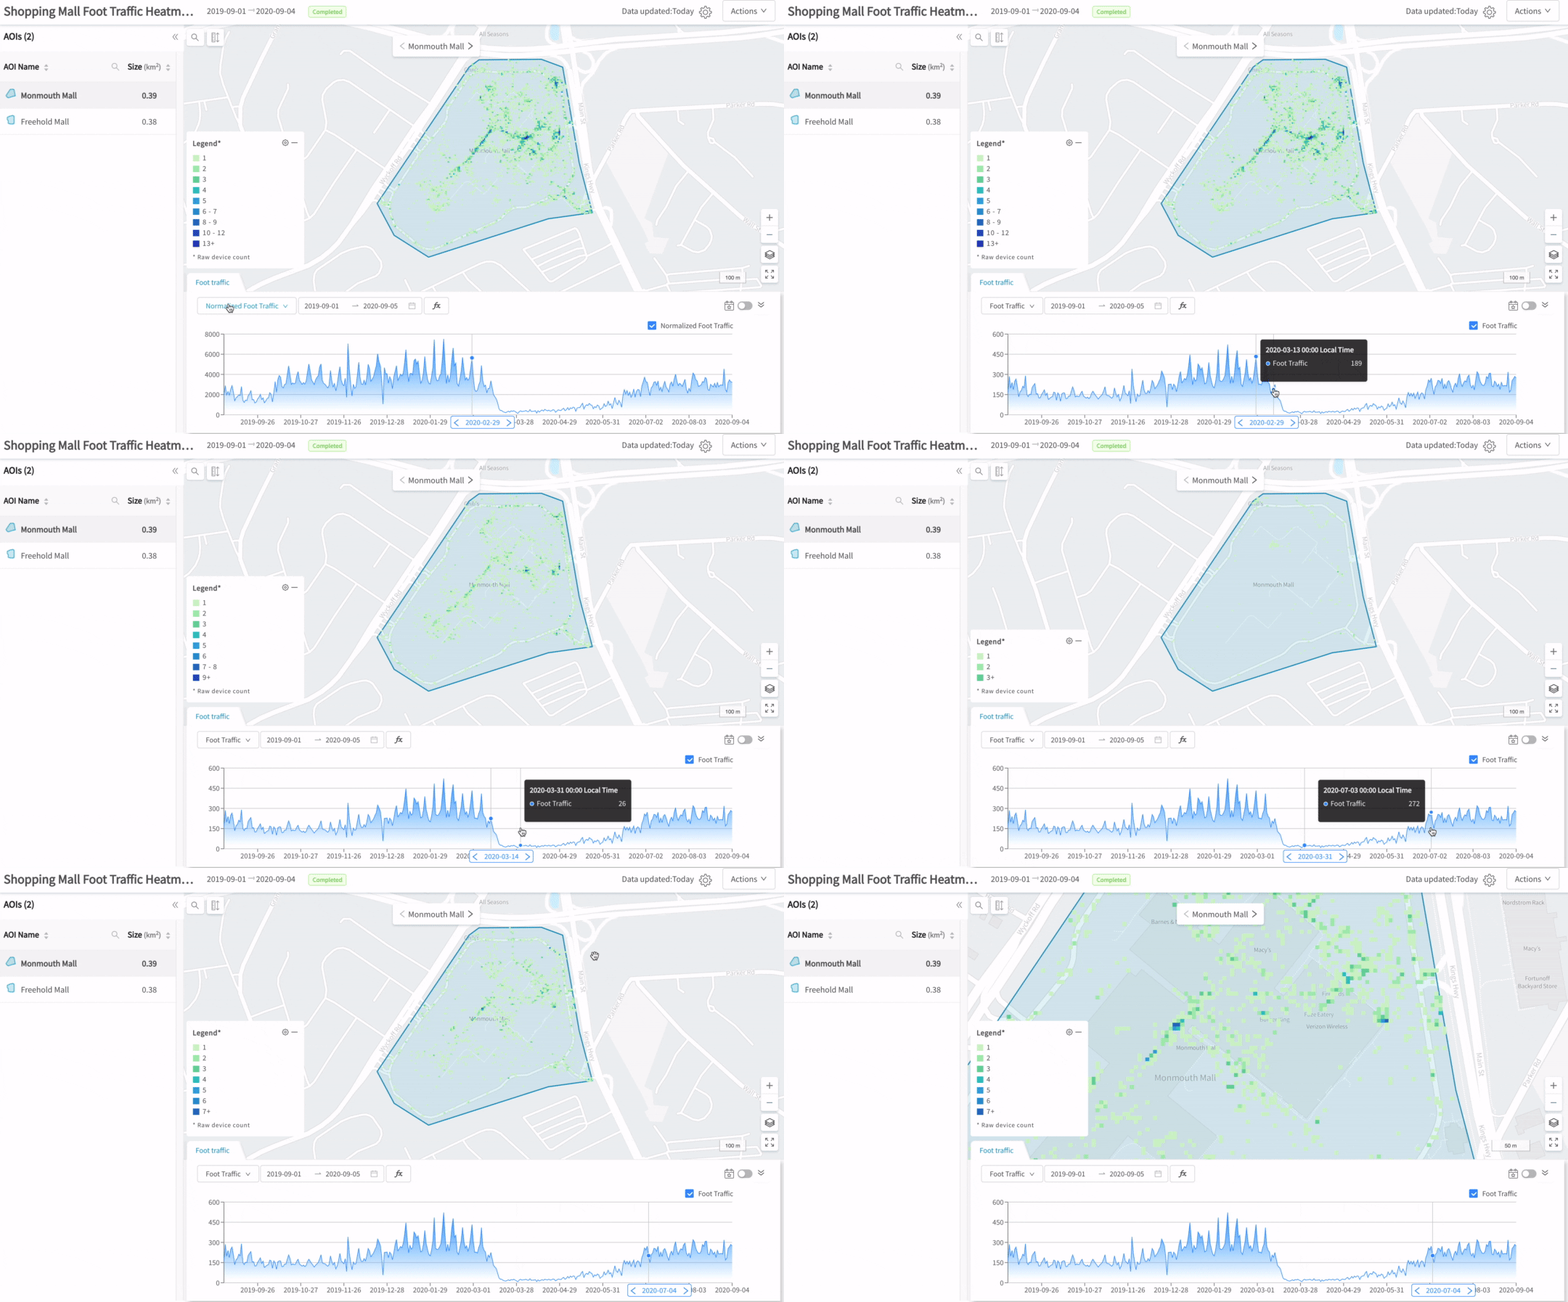
Foot traffic can also be configured to output heatmaps showing where devices are observed within your AOIs.

Foot Traffic heatmaps show the spatial distribution of devices within an AOI
Parameters
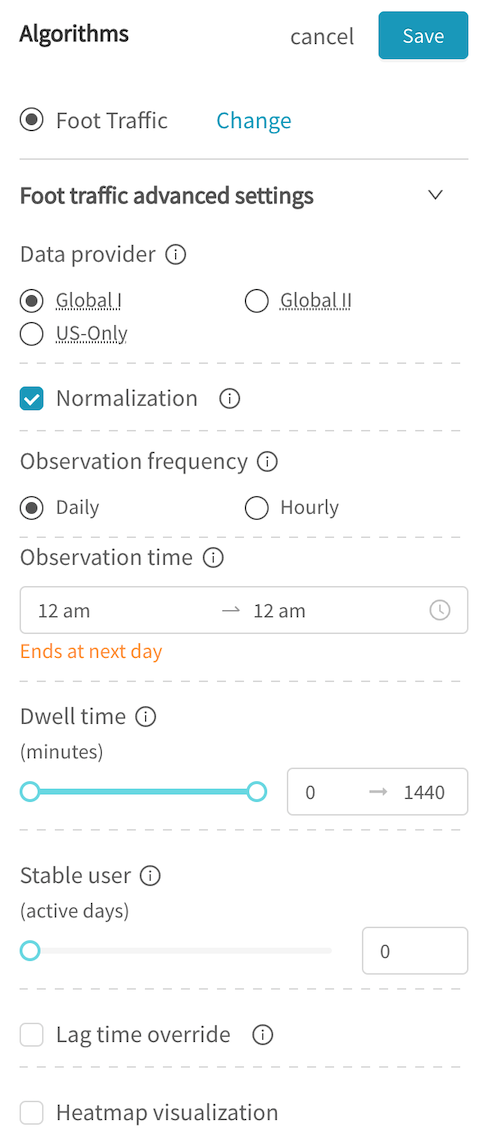
- Data provider: select from available data providers
- Normalization: turns on time series normalization - on by default
- Observation frequency: generate a daily or hourly result time series
- Observation time: filter for devices within a certain time of day, in local time (only available for daily observation frequency)
- Dwell time: filter for devices that spend a certain amount of time in your AOIs - you can set both a minimum and maximum dwell time
- Stable user: filter for devices that are seen in the device panel for at least a certain number of active days, in the past 32 days on a rolling basis
- Lag time override: by default, for each day in the analysis period, the algorithm waits for all data to be available at your AOIs before producing a count for that day (see provider-specific latency). This override will produce data as soon as possible, while updating the counts as more data arrives. However, for the most recent few days in an open-order project, counts may be incomplete.
- Heatmap visualization: enables the heatmap and configures heatmap resolution

Results
Time Series
Foot traffic produces primarily time series results. Up to 2 time series are produced:
- Foot Traffic (
raw.count): unique device count on each day / hour at the AOI, applying all the filters as configured - Normalized Foot Traffic (
uznorm.count): normalized foot traffic estimate on each day / hour at the AOI, taking the Foot Traffic time series and then applying normalization as described.
Depending on the observation frequency parameter setting, either a daily or hourly time series will be produced.
(raw.count and uznorm.count are the timeseries type IDs in the API)
Heatmap
If heatmaps are enabled, a spatial heatmap will be produced for each AOI and each day / hour in your time series.
Heatmap data accessibility
Due to the large data size associated with heatmaps, they are currently only accessible in the results UI and results downloads.
In the download package, heatmaps are provided as parquet files. Please contact us for assistance in working with heatmaps.
Constraints
There are certain constraints that apply to projects with the foot traffic algorithm:
- Maximum of 10,000 AOIs
- Each AOI must be ≤10,000 sqkm
- Each AOI must be defined by ≤10,000 vertices
In addition, as heatmaps produced a significantly higher volume of data, these additional constraints apply to projects with heatmaps enabled:
- Maximum of 20 AOIs
- Total size of all AOIs must be ≤1,000 sqkm
- Maximum of 745 observation periods (~2 years date range for daily, 1 month for hourly frequency)
Updated about 3 years ago