Geolocation - Traceability
The Traceability algorithm analyzes your AOIs to identify where devices are coming from / going to. In essence, it looks for devices that appear at your AOI, and traces their movements in aggregate within a customizable window before / after the devices are at the AOI.
Using the Traceability algorithm
- Draw your AOIs as usual
- Select the Traceability algorithm
- Set a date range for analysis
- (Optional) Tweak the parameters as needed
- Click Run!
The Traceability algorithm is highly customizable to suit your business case. The key things to think about when configuring the algorithm are:
- How can I best isolate the devices of interest? ➔ AOI configuration
- How long before/after devices arrive at the AOI, do I want to analyze movements? ➔ Before- & After-AOI parameters
- Do I want to identify where devices stop, or the routes they take? ➔ Velocity filter parameters
AOI configuration - example
If the goal is to analyze truck movements with Traceability, it is best to configure AOIs that cover only the truck loading/unloading areas within a facility. Because the AOI determines which devices are analyzed, a highly specific AOI will result in better results.
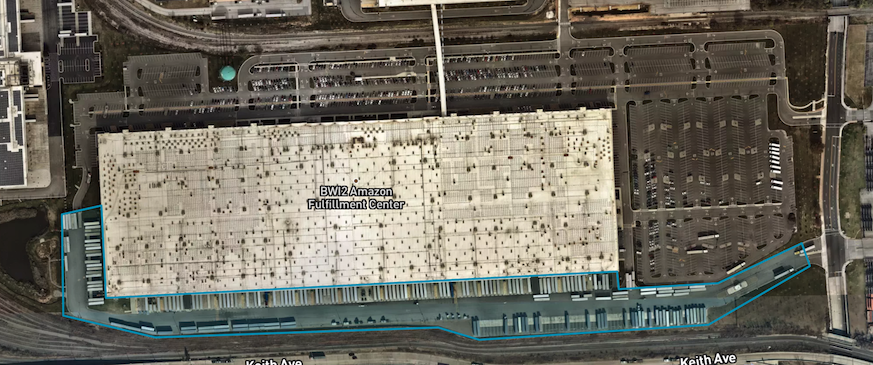
Isolating truck traffic at Amazon with an AOI around the loading / unloading areas
Support for open-order is work-in-progress
We are currently working to support open-orders for Traceability (ETA mid-2021).
Privacy protection by design
The algorithm is designed to produce analysis of aggregated movement patterns across many devices. There are privacy safeguards in place to prevent its use for individual tracking.
Parameters
Basic Parameters
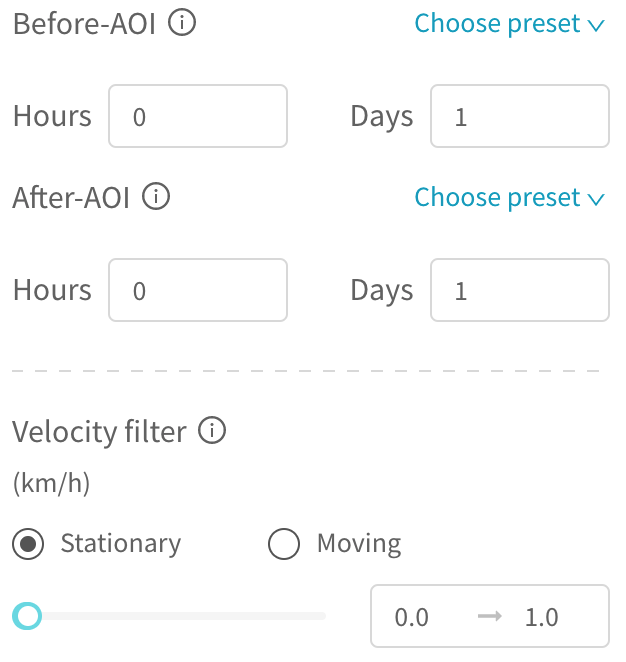
- Before-AOI: how long before devices arrive at the AOI, to analyze movements for those devices
- After-AOI: how long after devices leave the AOI, to analyze movements for those devices
- Velocity filter: filter for locations where devices have stopped (default), or where the devices are moving
- This is based on the calculated velocity of each location data ping
- Alternatively, set a custom min/max velocity range
Advanced Parameters
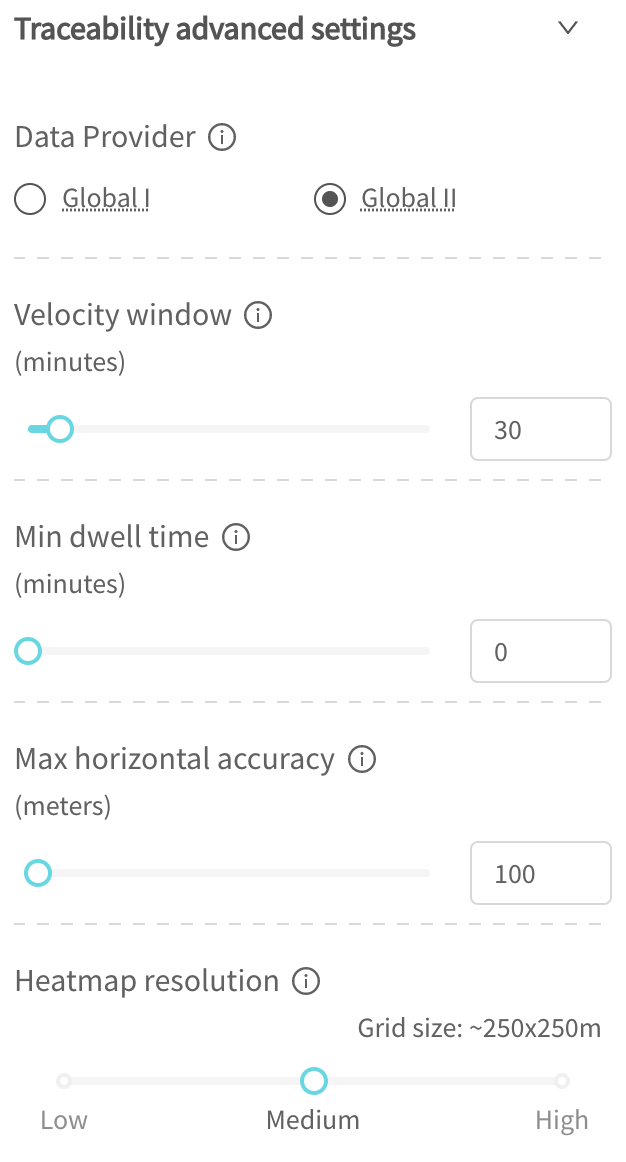
- Data provider: select from available data providers
- Velocity window: some devices report their location infrequently - we only calculate velocity for location "pings" that are within this time window of each other
- Min dwell time: ideally used with a stationary velocity filter; sometimes devices stop only momentarily at a location (eg at a traffic light) - this filters for device locations where the devices have stopped for at least a minimum length of time ("dwell")
- Max horizontal accuracy: devices report their locations with a horizontal accuracy - ie how accurate the GPS location is - this filters for location pings that are reasonably accurate
- Heatmap resolution: one of the outputs of the algorithm is a heatmap showing locations where devices have come from / gone to; this configures its approximate resolution
Min dwell time filter
This filter is fairly aggressive at filtering out location pings that are not seen consecutively in the same area for at least the configured amount of time. Setting a value that is very high may result in loss of useful signal in the results.
We provide a default of 0 because many countries globally have sparse data that is impacted by using this filter.
However, in countries with high data coverage (particularly the USA), we have found that a value of 5 - 15 minutes produces better results with good signal-to-noise.
Results
The results of Traceability are provided in 2 forms - heatmaps & clusters - identifying locations that are linked to your AOI by device movements.
Each AOI in your project has 1 set of heatmap & cluster results.
Visualizations in the GO user interface are work-in-progress
We are currently working to support visualizations directly in the user interface (ETA mid-2021). Currently, you may retrieve results via API and download. Please contact us for any assistance.
Heatmap
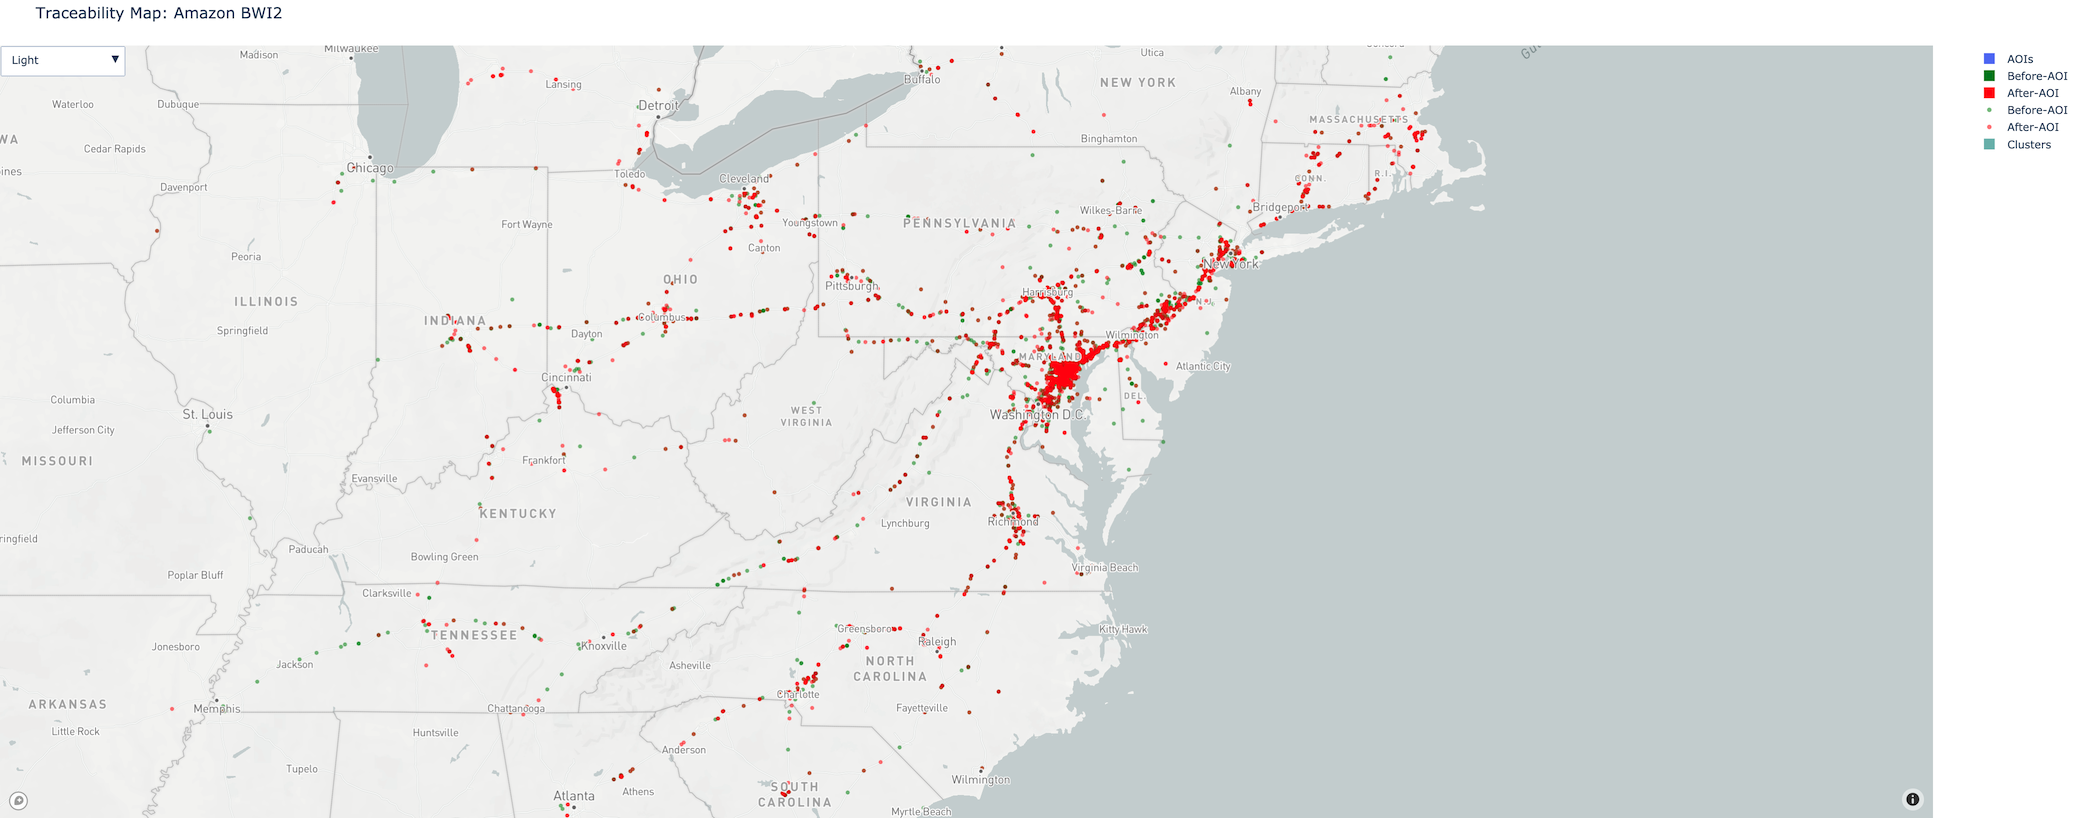
Heatmap results - showing areas linked to the Amazon BWI2 fulfilment center
Traceability heatmaps provide information on where devices at your AOI have come from / gone to. The heatmaps are generated based on the location data, after filtering based on the configured parameters.
Each record in the heatmap results corresponds to a single grid cell.
Heatmap results are provided as before- and after-AOI layers
We classify device movements ("trips" - see below) as being "before-AOI" (device is at a location before arriving at your project AOI) vs "after-AOI" (device has gone to the location after leaving your AOI). The heatmap example above shows these as green (before) and red (after) layers.
Certain device trips can be considered as both "before" and "after":
- Trips within your project AOI are considered both "before" and "after"
- If a device leaves your AOI, then comes back to it, the trip in-between is considered both "before" and "after".
Heatmap grid is defined in decimal degrees
The heatmap output is defined by a grid that has uniform spacing in units of decimal degrees. The approximate equivalent, in meters, is displayed in the user interface.
The advantage is that heatmap results from multiple projects & AOIs - as long as configured with the same resolution - can be overlaid and compared easily as they belong on the same grid.
However, note that due to the spheroid surface of the Earth, the resulting heatmap grids are largest (in land area) at the equator, and progressively smaller as they get closer to the poles.
Clusters
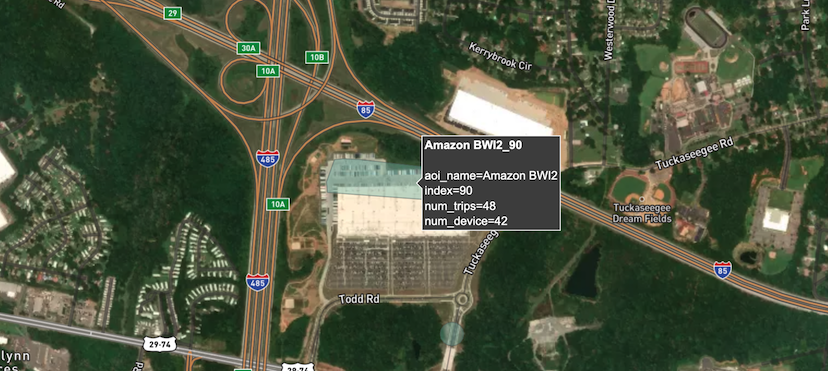
Example cluster corresponding to the Amazon CLT4 fulfilment center (linked to Amazon BWI2)
Traceability clusters automatically identify "hotspots" where many devices have congregated in the same location. The clusters are generated on the same location data as is used for heatmaps - the same filtering is done based on the configured parameters.
A density-based clustering algorithm is used to generate clusters. Cluster geometries are then generated as convex hulls - these are returned in the results.
Metadata
The following metadata is provided for each record in the heatmap & clusters results:
geometry: of the heatmap cell / cluster, as a polygon in WGS84 coordinatestotal_trips: total number of trips observed between this location and your AOItotal_devices: total number of unique devices associated with all tripsbefore_trips: number of trips from this location to your AOIbefore_devices: number of unique devices associated with the "before" tripsafter_trips: number of trips to this location from your AOIafter_devices: number of unique devices associated with the "after" trips
Understanding "trips"
A trip is counted toward a heatmap cell or cluster, when we see device location pings at that location within the specified Before- / After-AOI time window of your AOI.
A single device may make multiple trips to the same location! As such, we recommend using trips as the primary measure of the strength of relationship between your AOI and a new location identified by Traceability.
Important: a trip may be considered both "before" and "after" in certain cases. Take for example a device that goes from your project AOI A → new location B → A. The trip to B is considered both "after" (because the device went from A → B) and "before" (because the device then went from B → A). As such, 1 trip will be counted towards both
after_tripsandbefore_tripsfor B. It also counts as 1 trip towardstotal_trips. As such,total_tripsis not necessarily the sum ofbefore_tripsandafter_trips.
Privacy Safeguards
The following safeguards are put in place to prevent abuse of the Traceability algorithm for individual tracking:
- Each AOI must have at least 5 unique devices over the analysis period
- Each heatmap grid cell & cluster must have at least 2 unique devices
- Heatmap grid cells cannot be smaller than ~100x100m
- Clusters cannot be smaller than 5000m2 - small clusters will be buffered to at least this size
Higher-resolution heatmaps may lose more signal to privacy filtering
Because GO filters out any heatmap grid cells that have only 1 unique device seen - choosing a higher resolution heatmap may mean that more grid cells get filtered out.
For instance, at 250x250m resolution, a given grid cell may have 2 devices associated with it. If the resolution is brought down to 100x100m, the 2 devices may be split into 2 separate grid cells, and therefore filtered out from results.
Updated over 3 years ago