Imagery Selection
This page covers how to configure imagery selection in GO for algorithms that are based on imagery (satellite, aerial, etc).
Select Algorithms
Once you have configured your project AOIs, select your desired object detection or land use algorithms from the Algorithms panel, and click Save:
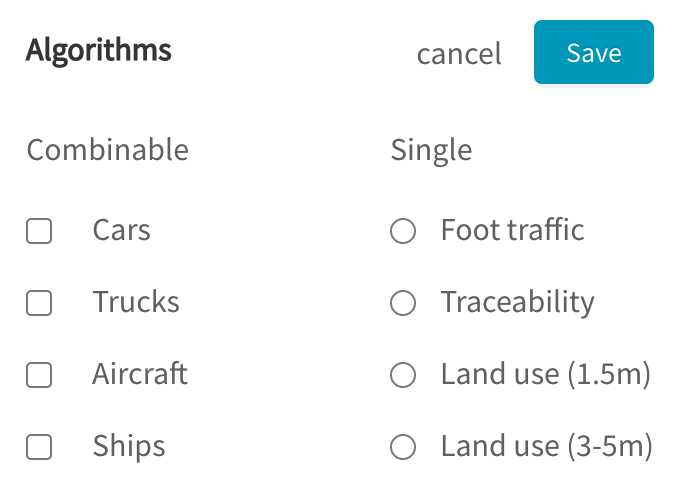
Imagery Selection
You may then configure the imagery that will be analyzed, under "Time Range and Constraints".
Basic Configuration
Under the basic configuration, you can configure the
- Start and end date of analysis
- Use of the default or extended catalog
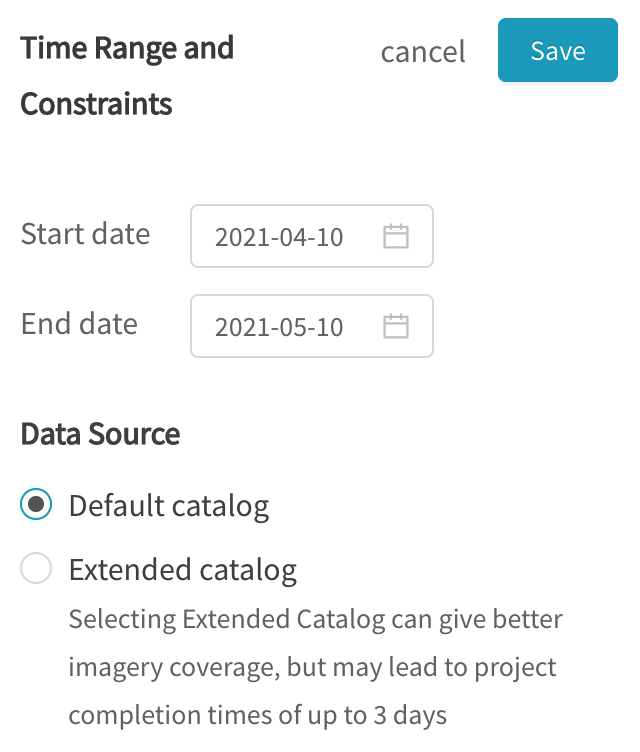
Configuring an open-order project
You may configure your project to be "open-order" and run continuously in future, by selecting an end date that is in the future. Your project will then run daily to check for new imagery, and automatically update with new results.
Note: new open-order runs are processed every 24 hours from when the project is first run. In future, we are looking to build in more fine-grained controls over when and how frequently these open-order runs take place.
To learn more about open-order projects, click here.
Extended catalog
This is only applicable to the Cars, Trucks & Aircraft algorithms, which use an imagery provider that offers an "extended" catalog, but with a longer SLA of up to 3 days for delivery of imagery.
You may find that your AOIs have more imagery with the extended catalog. However, due to the longer potential wait time, this option may be more suitable for less time-sensitive, longer-term trend analysis.
Advanced Configuration
The advanced configuration of object detection algorithms can be broken down into 2 parts: imagery filtering, and imagery sampling.
Imagery filtering
- Min area coverage: the minimum % that each satellite image must cover an AOI, to be selected for analysis
- Max cloud coverage: the maximum approximate cloud coverage for a satellite image to be selected
- Max incidence angle: this is the angle between the satellite's view direction (direction it is pointing at the Earth), and the ground normal (an imaginary line pointing straight up, at the target). This is roughly approximate, but not exactly equal to the off-nadir angle.
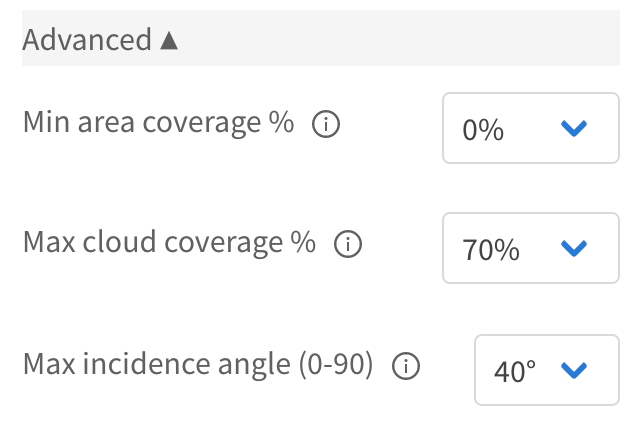
Imagery filtering
Imagery filtering - suggested defaults
Object detection: 0% min area coverage, 70% max cloud coverage, 40° max incidence angle
Land use: 10% min area coverage, 40% max cloud coverage, 40° max incidence angle (this may need tuning depending on your AOI and needs - please contact us for help)
Cloud filtering at this step is approximate
At this step, GO has not yet ordered and received the imagery, and so relies on what the satellite imagery providers have calculated as an approximate cloud coverage for the entire satellite image. As such, it is possible that an image with a 70% cloud cover may still be non-cloudy over your AOI.
Once GO has processed the imagery, a much finer-grained computer vision algorithm (our "pixel cloud" algorithm) is used to determine the exact extents of clouds in the image. Our object detection algorithms are also trained to ignore such cloudy areas.
Imagery sampling
- Collect all scenes available: this will utilize all the available imagery ("scenes"), as long as it meets the filtering criteria
- Sampling period: sample only a certain amount of imagery, in cases where there is much more imagery than desired.
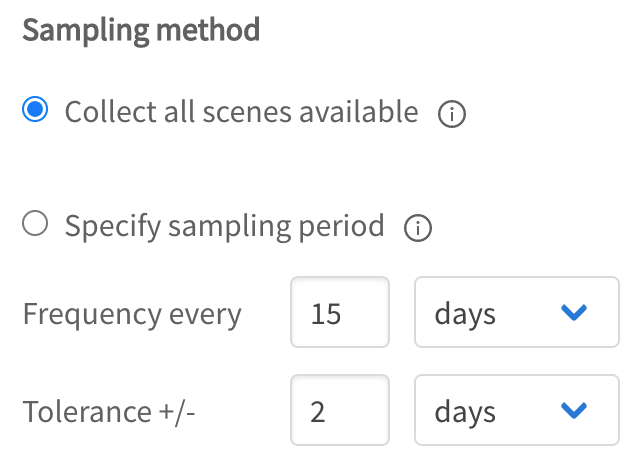
Imagery sampling
Imagery sampling - suggested defaults
Collect all scenes available
Explaining the imagery sampling period
- There is a
frequencyandtoleranceparameter- From the project start date, every
frequencydays, GO will look for the single best image within +/-toleranceof days.- For example: if your project starts on 1 Jan 2020, and you configure sampling with a 10 day frequency and 2 day tolerance, the sampled periods will be 1 Jan 2020, 11 Jan 2020, 21 Jan 2020, ... GO will then look +/- 2 days of those sampled periods, ie 1-3 Jan 2020, 9-13 Jan 2020, 19-23 Jan 2020...
Imagery Availability
As you adjust the project and imagery selection parameters, you can click on each individual AOI to see how much imagery is available to be analyzed.
The bars in the chart on the bottom correspond to individual "scenes" (satellite images). Each bar corresponds to a single day; click on any bar to see the extents of the full scene, shown on the map in orange.
If there are multiple scenes on a single day, they will each be displayed as a separate polygon on the map.
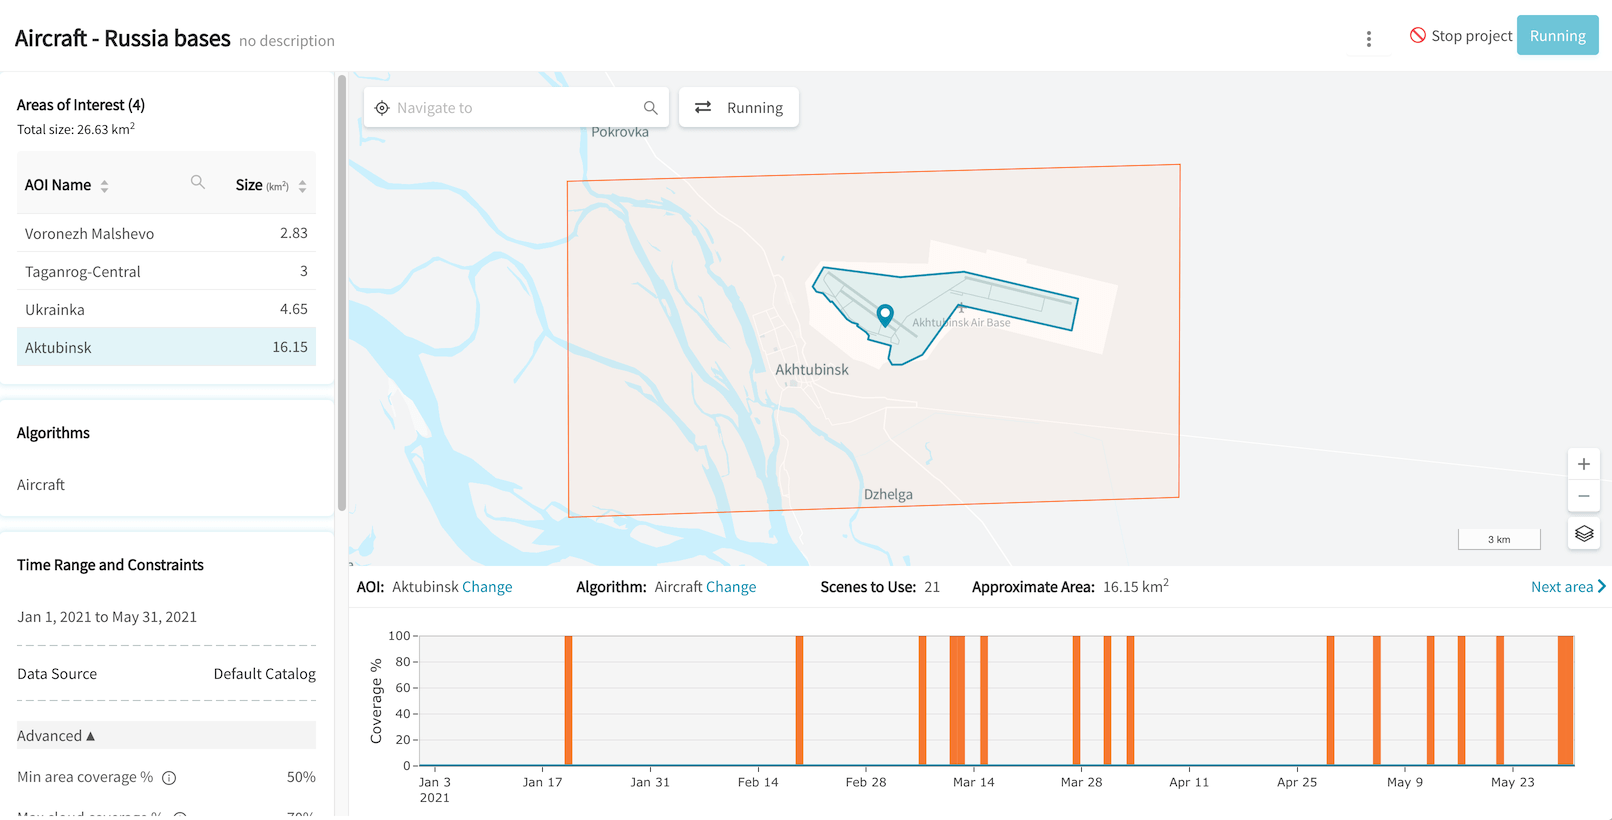
Imagery availability (revisit) chart for an AOI
Only imagery within your AOI will be analyzed
Satellite scenes may be very large in size, but only the part of the scene within your AOI will be analyzed & charged accordingly. This means that you only pay for the part of the scene that is relevant to you.
Updated over 3 years ago