Time Series Results
Time series results data consists of counts (of objects, devices, etc) over time. Time series results are produced for the following algorithms:
- Object detection: how many detected objects are within each image - with multi-class algorithms, a time series is produced for each class
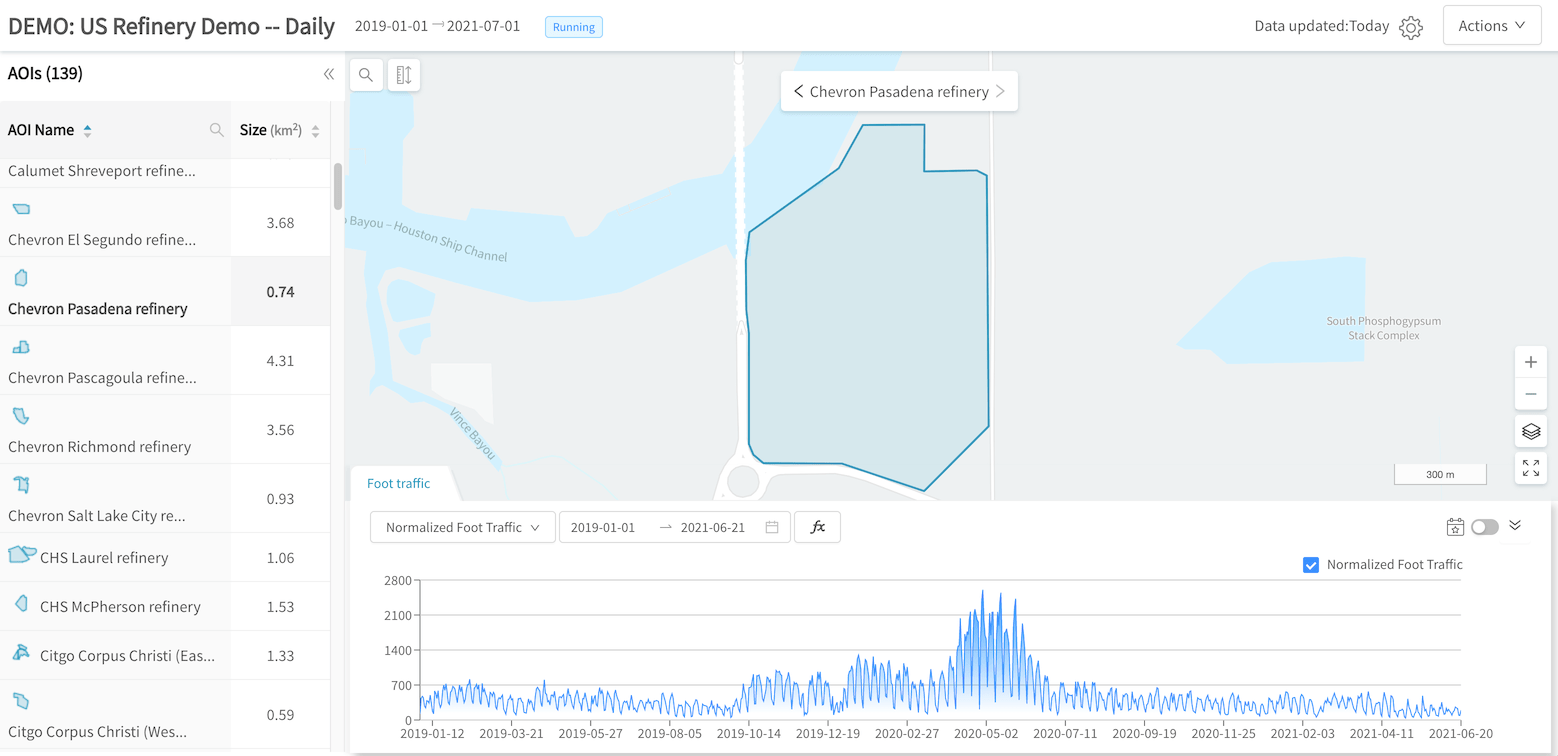
- Foot traffic: how many devices are observed within your AOI on each day (or hour, depending on configuration)
Interacting with Time Series Results
Time series results are displayed as a chart on the bottom in the results page for your GO project:

Foot traffic results
From here, you may:
- Switch timeseries through the dropdown menu on the top-left of the chart
- Zoom into a specific date range by clicking and dragging on the chart, or by using the date range selector
- Toggle markers for charts
 (note: only for object detection time series)
 - Toggle shading for weekends & holidays
 (note: this only shows USA holidays)

Switching timeseries and zooming into a date range
Updated about 3 years ago