Quick Start
This guide will walk you through the 6 steps to get started using GO to understand what is happening on and to the Earth.
You will create projects, select and configure areas of interest and algorithms, run analysis, and get results. Subsequent sections will explain these concepts in more detail.
This assumes that you are already logged in to Orbital Insight GO.
Step 1 - Create a Project
What are projects?
GO projects are analyses configured by you to ask questions about the world. You determine where to look (areas of interest), what to count & measure (algorithms), and when (date range).
You may have as many projects as you need, each asking different questions.
To learn more about projects, click here.
Go to your projects page, then click on 
Choose a name and description for your project - this will help you keep track of your projects over time. Click on "Create Project" once you are done.
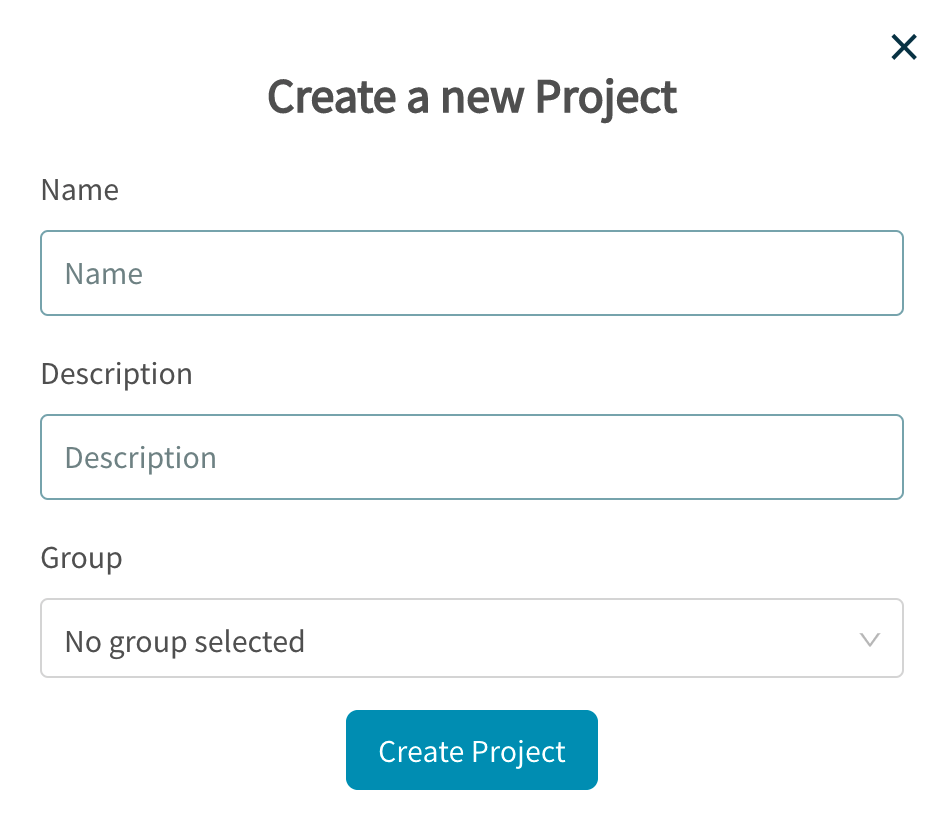
Creating a new project
Congrats! You have created your first project, and can now configure this project to ask questions about the world:
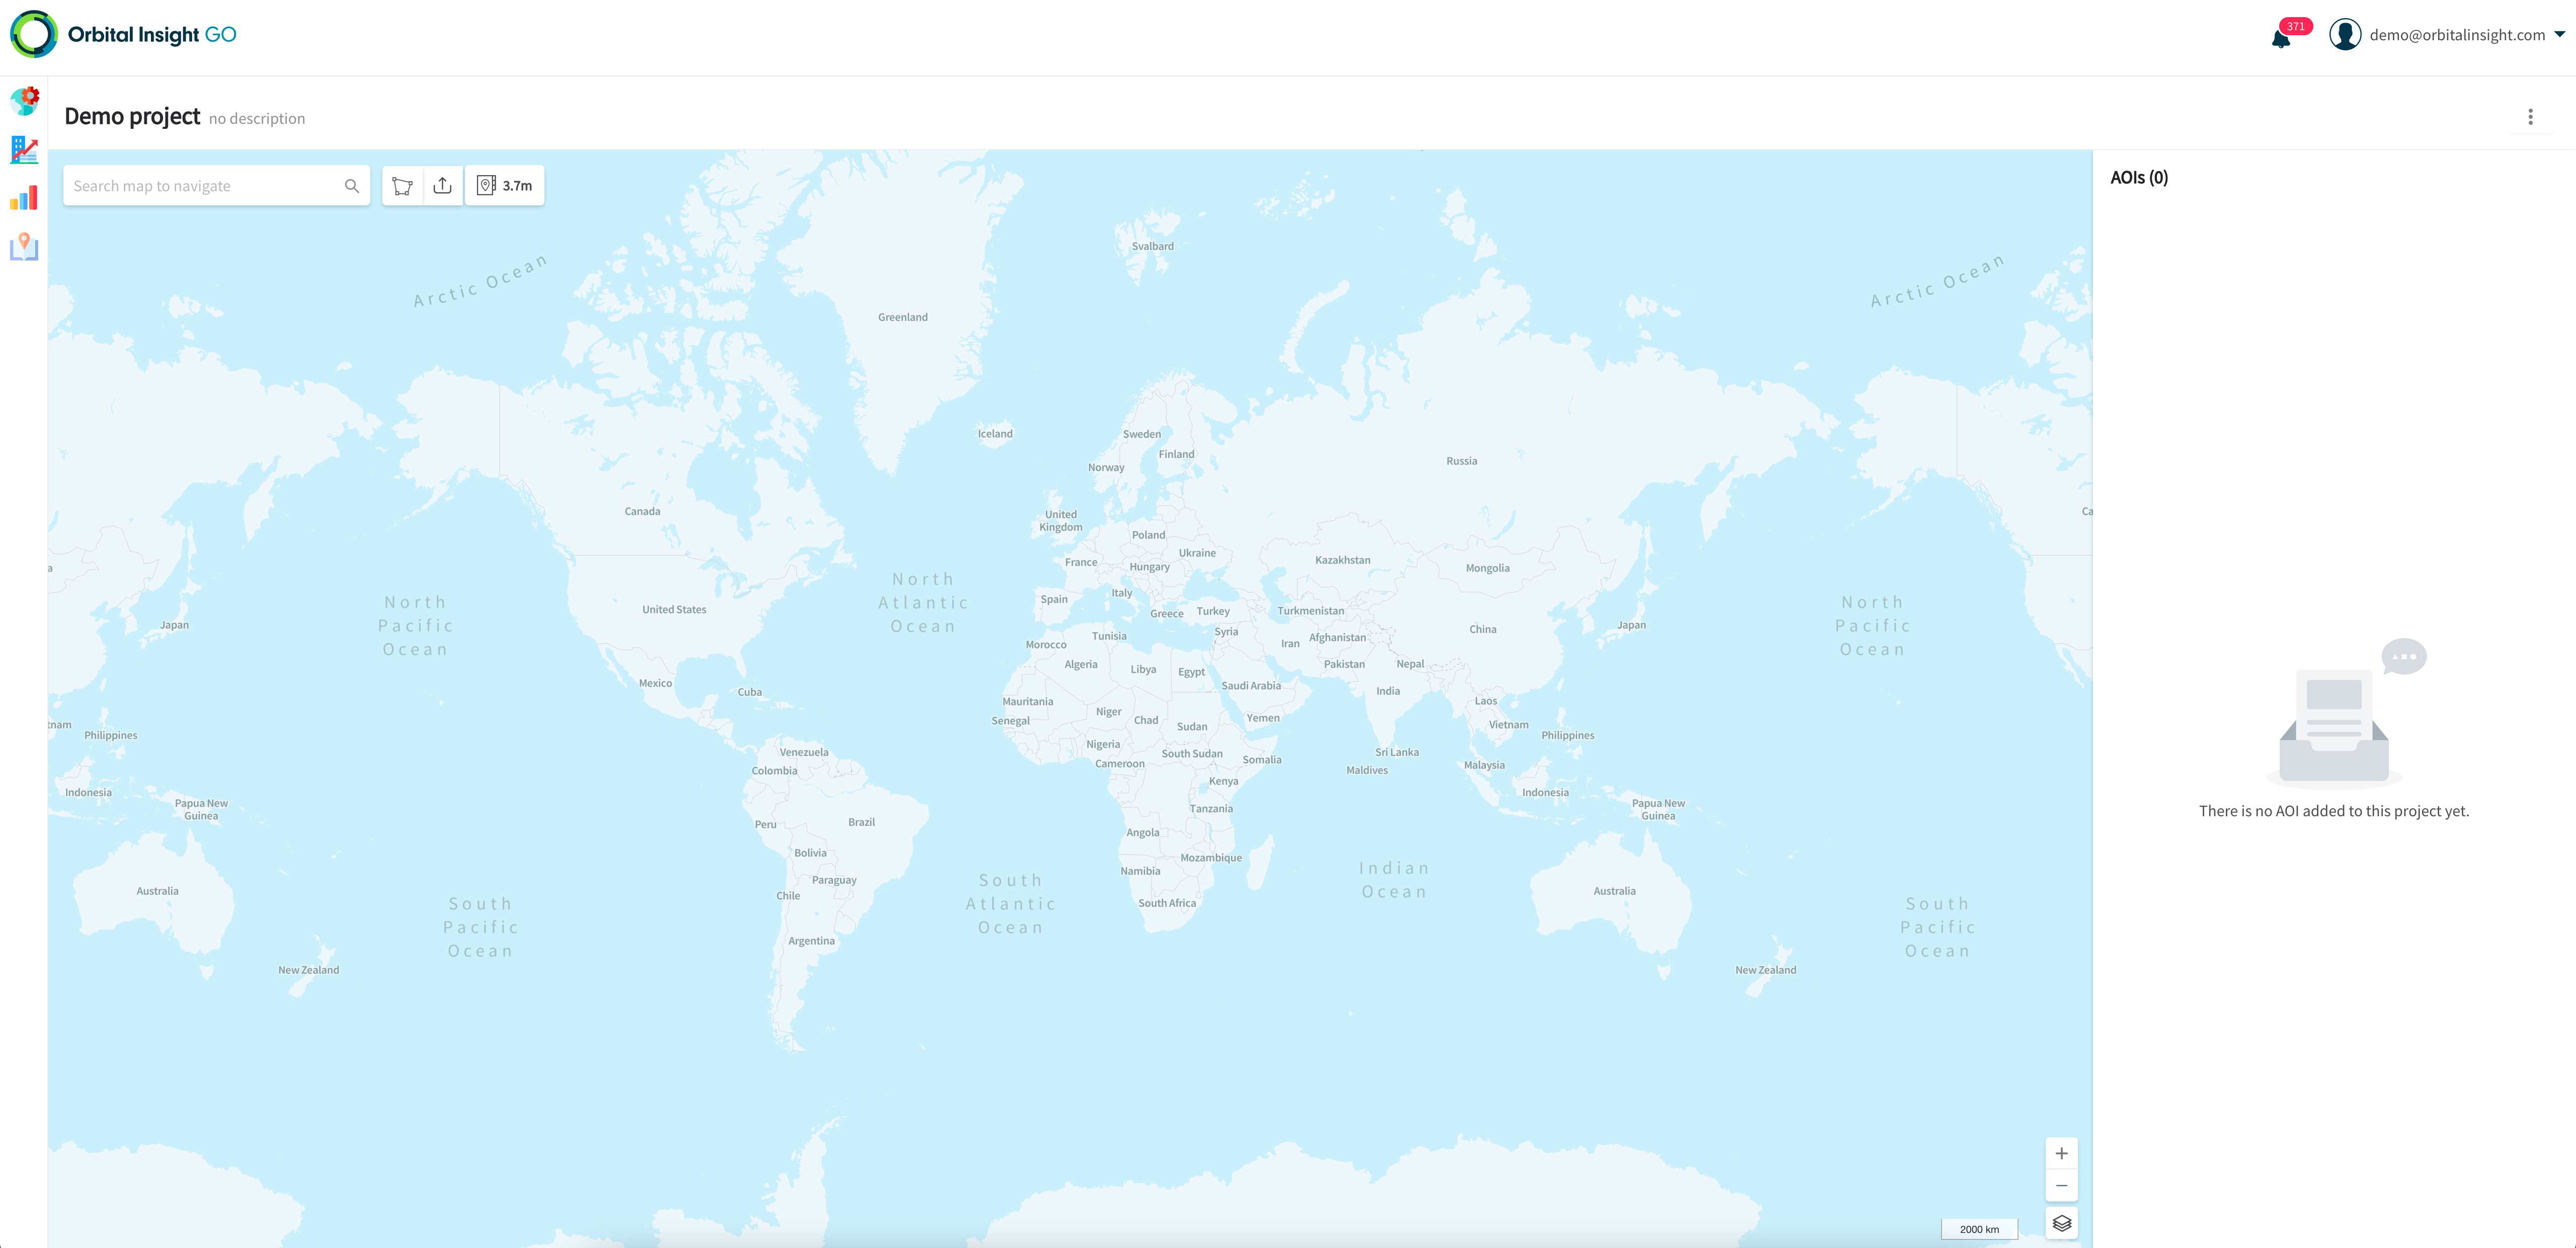
Step 2 - Select Areas of Interest (AOIs)
What are AOIs?
Areas of Interest (AOIs) let you determine where to run analysis of geospatial data. Each AOI corresponds to a polygon in geographic coordinates (latitude / longitude) defining an area on the Earth.
AOIs are created within projects. Each project may have multiple AOIs.
Some other terms for AOIs include: polygons, boundaries, geofences.
To learn more about AOIs, click here.
To select or create AOIs for your project, you will be using these tools at the top of the map.
 : Draw an AOI
 : Upload AOIs
 : Use an AOI from the AOI catalog
For this quick start, we will use the AOI catalog to search for the Ford Dearborn factory and use it in our project. Click on  to open the AOI catalog, then type "Ford Dearborn" into the search box, and hit Enter:

The search results appear on the map - bring your mouse over the  icon and you should see this pop-up with information about the AOI. Click on "+ Add" to add this AOI to your project.
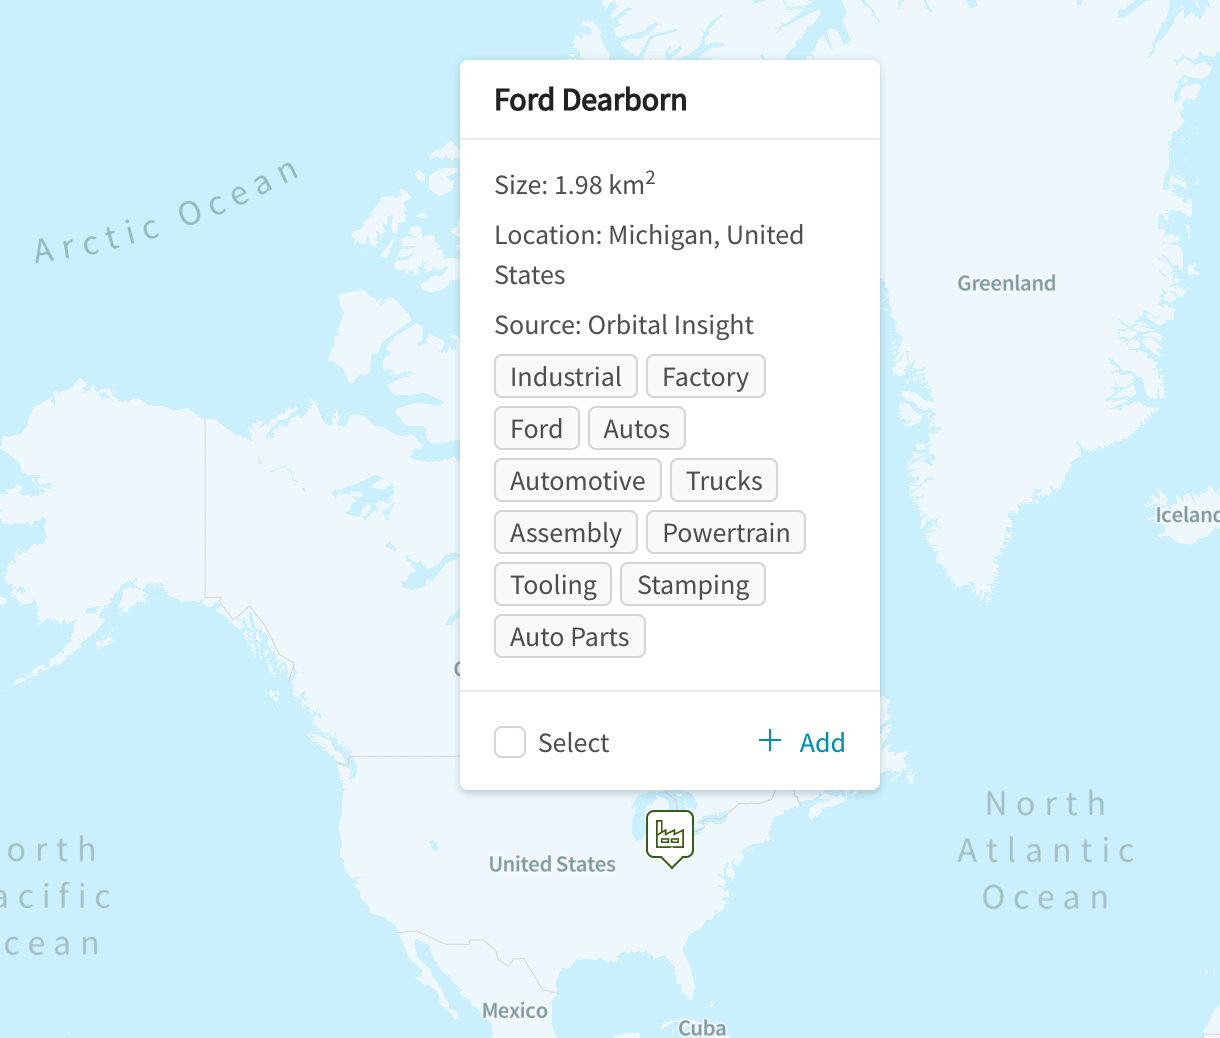
This AOI should now appear in your list of project AOIs on the right-hand panel. Click on "Continue to Algorithms" to continue.
Step 3 - Select Algorithms
What are algorithms?
Algorithms let you configure what you would like to count & measure - such as cars, trucks, or foot traffic. Each algorithm is tied to a particular data source, such as a satellite imagery provider - so by choosing an algorithm, you are also implicitly making a choice of data source.
Algorithms are configured within projects. Each project may utilize multiple algorithms.
To learn more about algorithms, click here.
The "Algorithms" panel is where you will select algorithms for your project. Click , then select "Foot traffic" and click "Save" to make your choice:
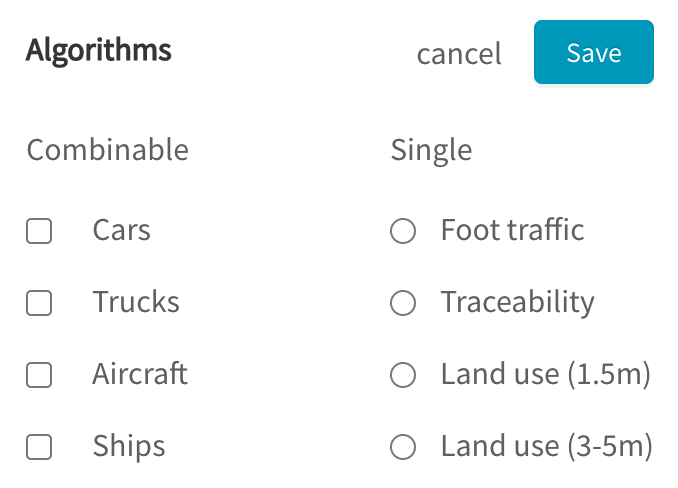
Generally available algorithms (more under development)
Step 4 - Configure Parameters
What are parameters?
Parameters allow you to configure more advanced settings for how the algorithms should work, as well as when to analyze your AOIs.
"How": Each algorithm has a set of configurable parameters, although the defaults should work well for most cases.
"When": You may analyze historical data to understand the context at your AOIs, and continue monitoring into the future for new data.
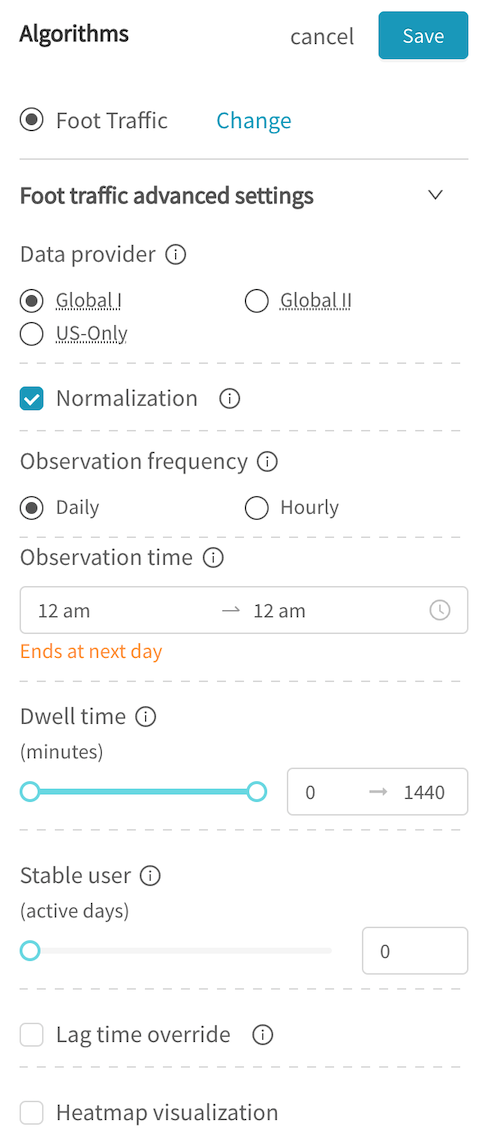
After selecting foot traffic, you should see a set of algorithm-specific parameters. Leave the default settings as they are (click here for foot traffic parameter details).
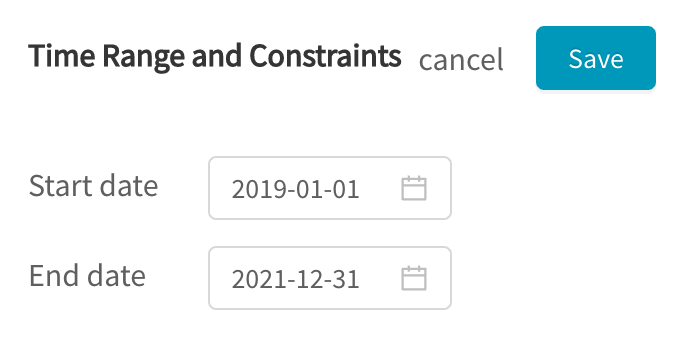
Next, under "Time Range and Constraints", set the start date to 2019-01-01 and the end date to approximately 1 year in the future, and click on "Save".
Step 5 - Run!
You are now ready to run your analysis! Simply click "Run" to begin.

The button displays the number of credits that the analysis will cost.
What are credits?
Credits are charged each time you run a project, and are calculated based on: (i) number of AOIs run (ii) amount of data being analyzed. You are not charged until you click Run.
To learn more about credits, click here.
GO will now start running your analysis in the background, and will send you an email once complete. For this example project with 1 AOI running foot traffic, it should complete quickly within 5-15 minutes.
Projects are locked after being run
Your AOIs, algorithms and parameters are locked after you run a project, so that your results can be tightly linked to the exact settings used to produce them.
If you wish to modify an existing project, you will have to clone the project, make your changes, then run the new project.
Step 6 - View Results
When you project is completed, you should receive an email with a link to view your results.
Alternatively, you can check on your GO projects page for the status of your project(s), and navigate to the results once available.
Using either way, you should arrive at a results view that looks like this:
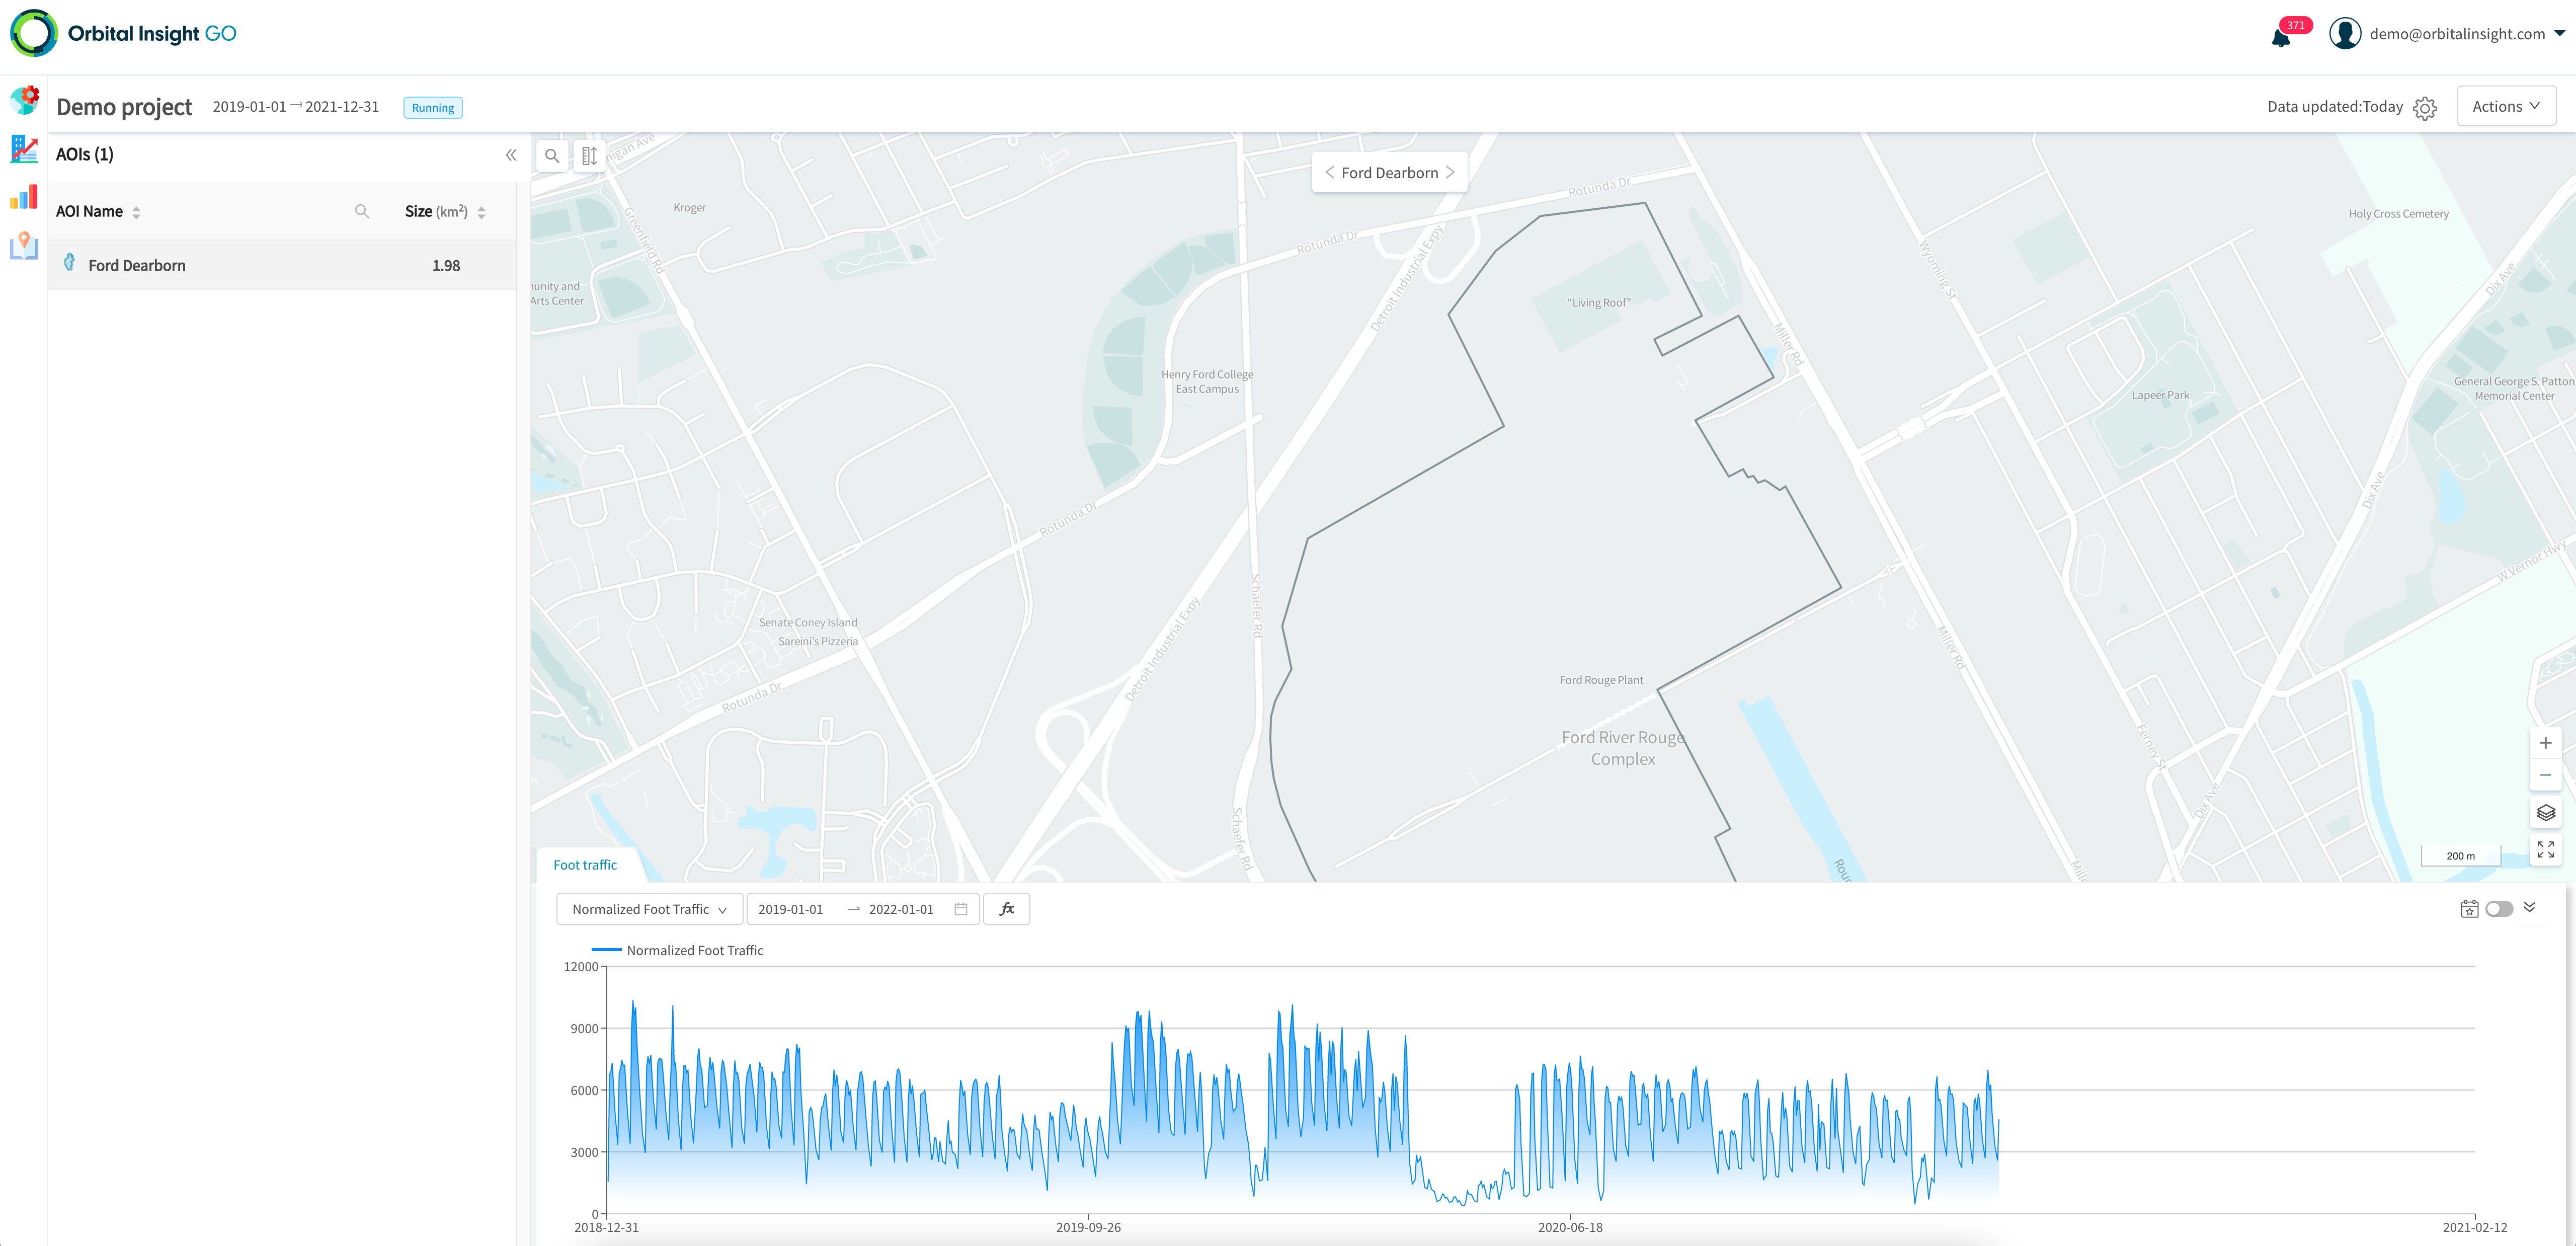
Your project AOIs are in a list on the left. In projects with multiple AOIs, you may navigate through this list to view results for each AOI.
The chart at the bottom shows you the time series results for the selected AOI. In the case of the foot traffic algorithm we have configured here, this shows the daily count of mobile devices seen at the Ford Dearborn factory, normalized for device penetration, and derived from the mobile geolocation data source.
To learn more about results, click here.
Open-order projects
If you have configured your project as suggested, with an end-date set in the future, you have an "open-order" project. Such projects are scheduled to run daily to analyze any new data available.
For this project, you can expect to see an updated time series with additional data points if you come back to it tomorrow, or further in the future.
To learn more about open-order projects, click here.
Updated about 3 years ago
Learn more about the following GO concepts: