View Results
The GO user interface allows you to quickly view results in spatial (eg object detection geometries) & temporal (time series) dimensions.
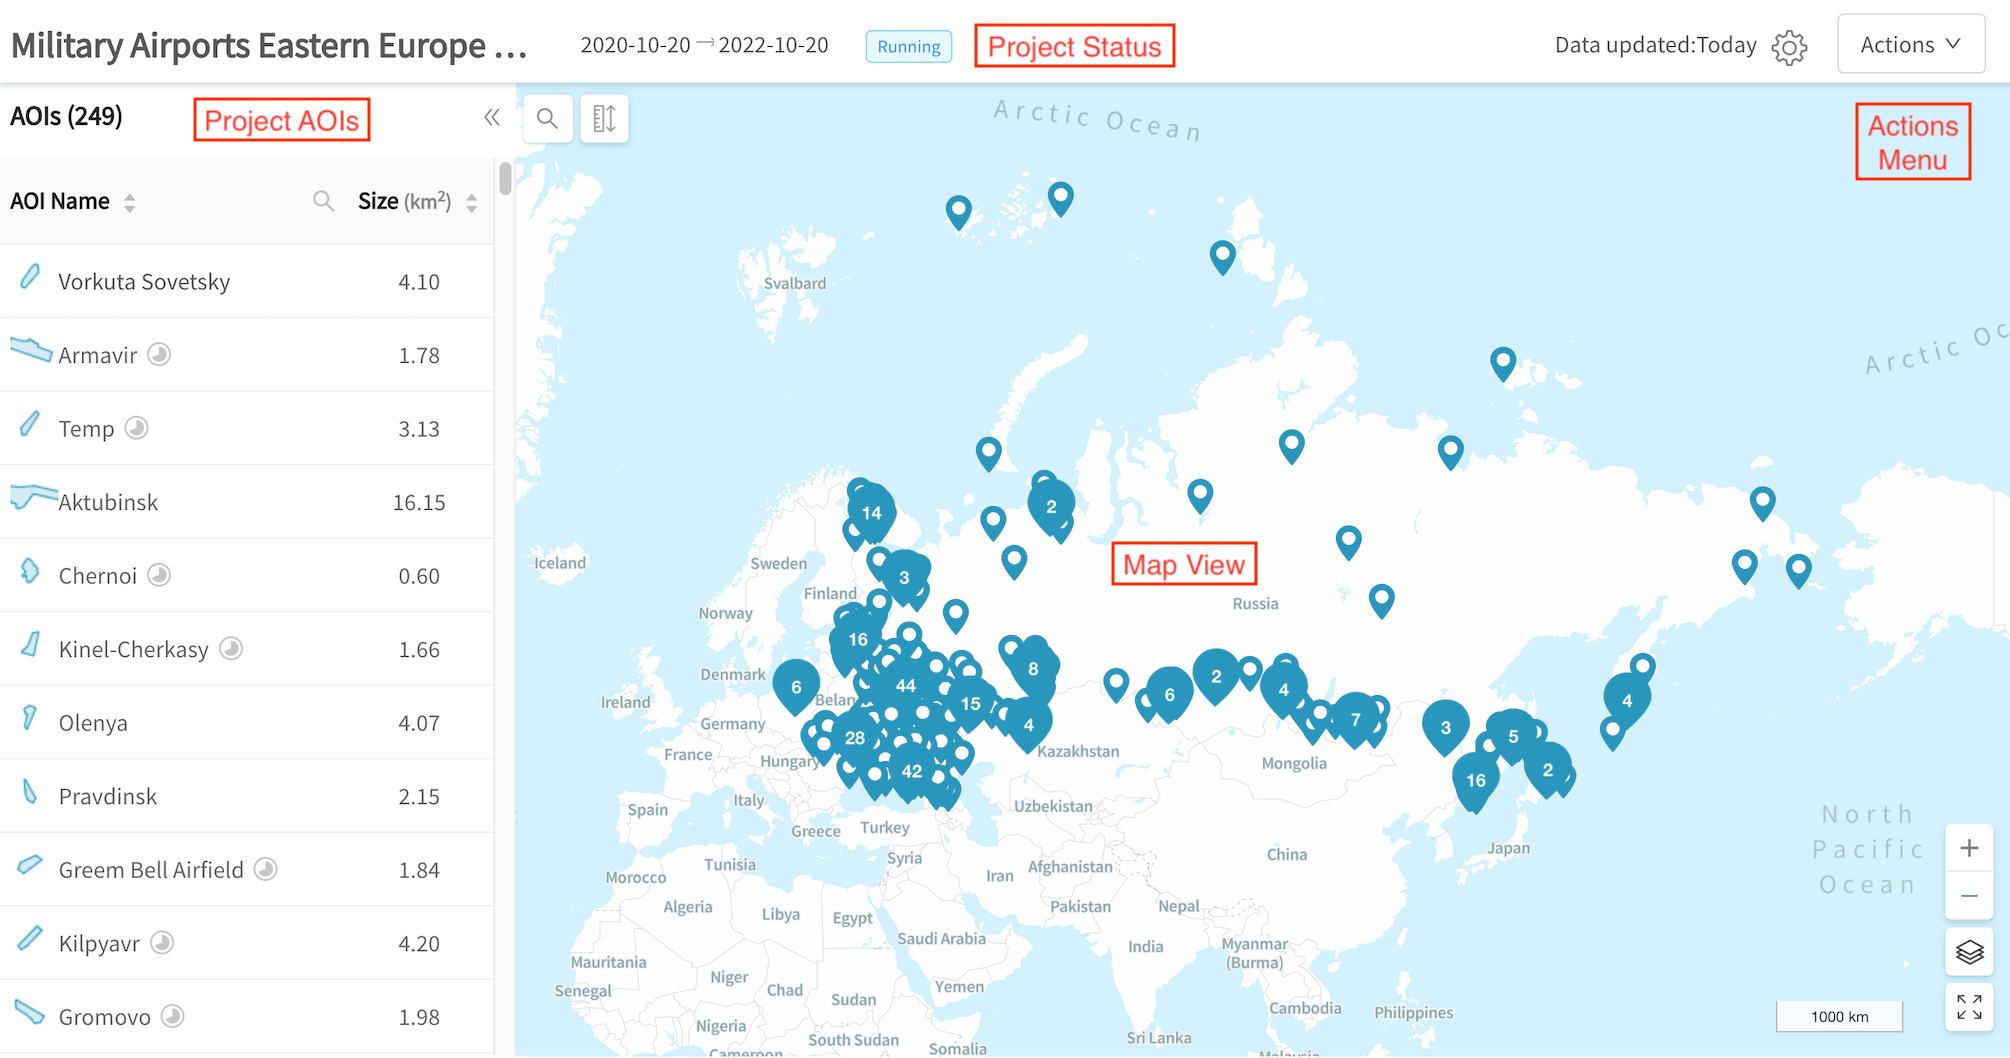
Results page layout
- The project name, date range & status are shown at the top
- Project AOIs are laid out on the left, allowing you to navigate between results for each AOI
- The map view initially shows you all project AOIs. As you click into results for an AOI, the map will display spatial results for that AOI.
- Where relevant, a time series chart will appear below the map (see algorithm-specific sections below)
- The actions menu at the top-right allows you to:
- Share, Clone or Delete the project
- Download results
- Export project AOIs as a download or to your AOI Library
Object Detection
Object detection results contain both spatial and temporal data:
- Spatial: where objects are detected within each image (object geometries)
- Temporal: how many objects are detected within each image (time series data)
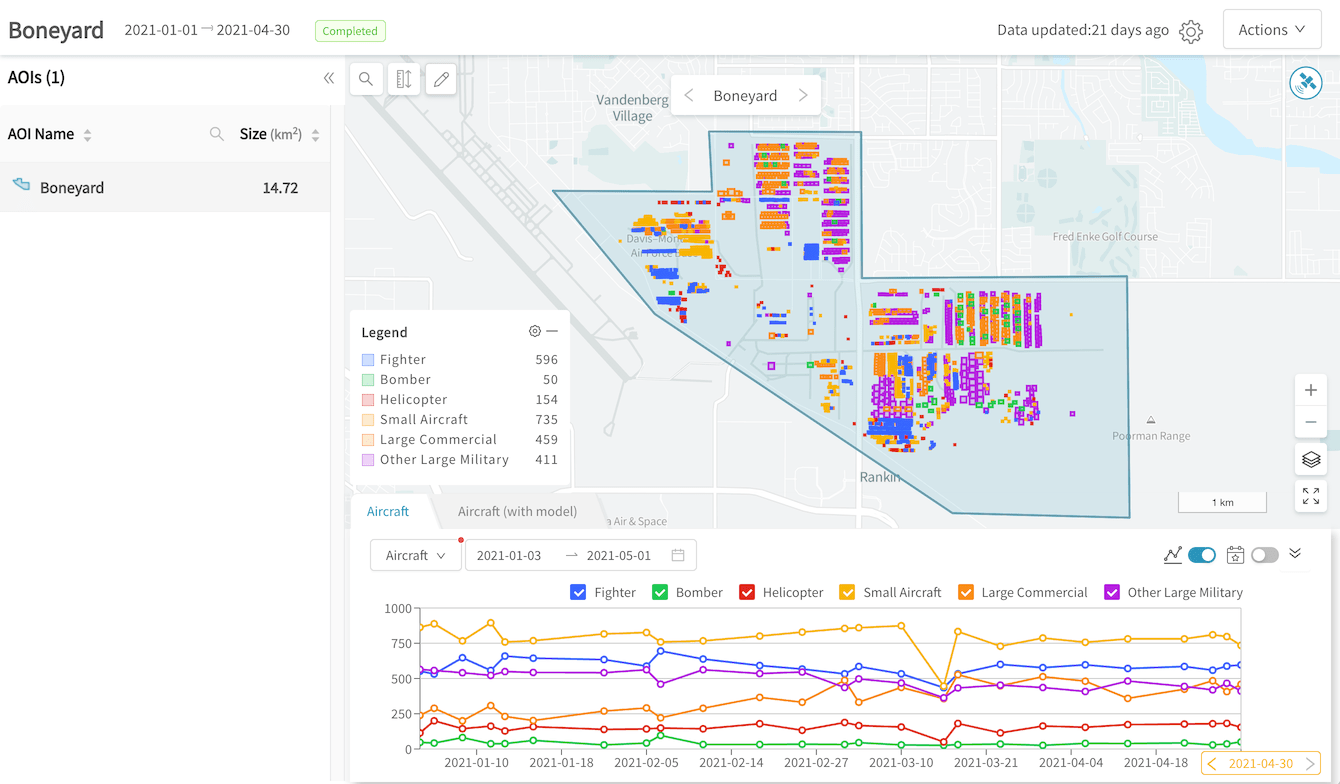
Object detection results
Explore object detection results:
- Navigate between AOIs to see their results by clicking on them in the left-hand pane
- Navigate between observations by clicking on data-points within the time series chart to view results for that observation
- Switch between algorithms by clicking on the algorithm tabs above the time series chart (if you have run your project with multiple algorithms)
- Visualize & manipulate spatial results
- Visualize & manipulate time series results
- Annotate results - fix algorithm errors (false positives / negatives; misclassifications) by clicking on
 at the top-left corner
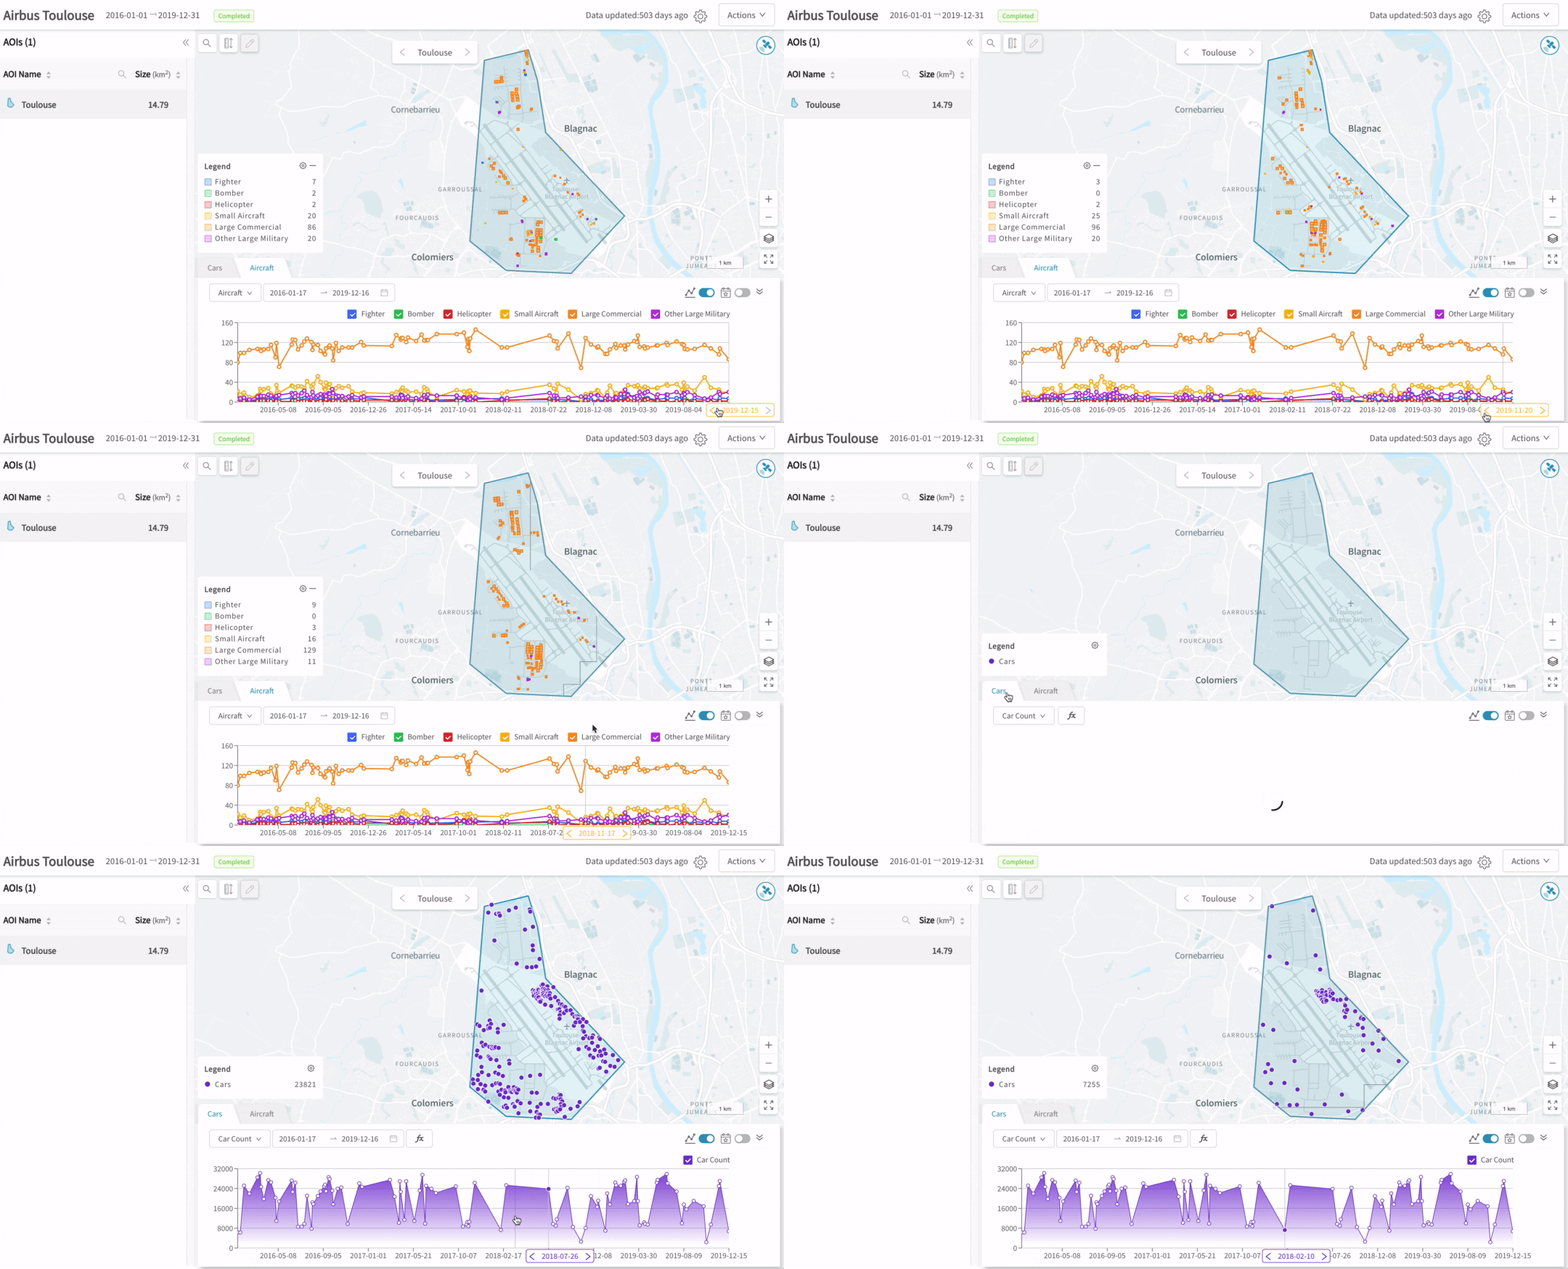
Navigating between satellite observations and algorithms in object detection results
Foot Traffic
Foot traffic results primarily contain temporal data:
- Temporal: how many devices are counted in the AOI on each day / hour (time series data)
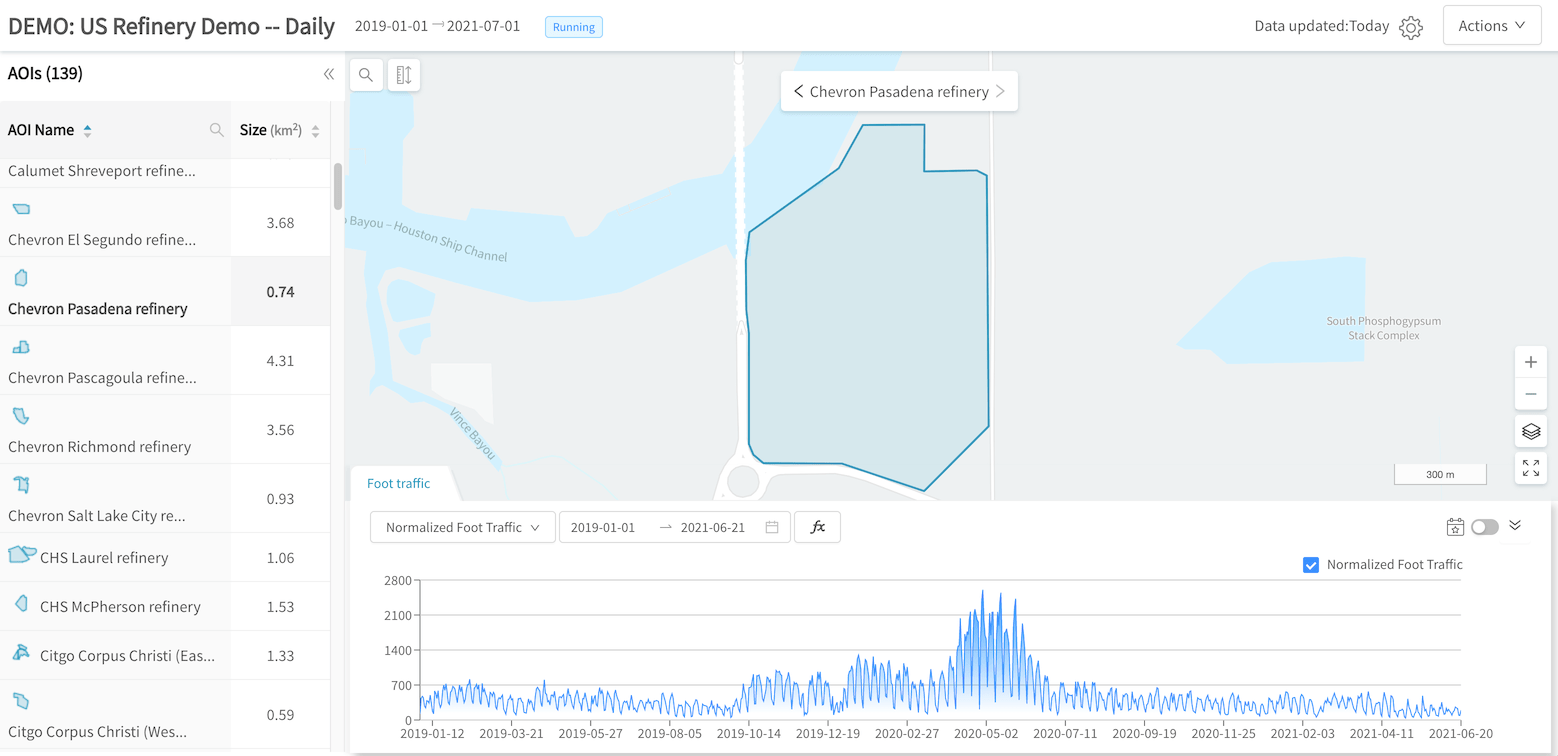
Foot traffic results
Optionally, if heatmaps have been configured for the foot traffic analysis, results will also contain spatial data:
- Spatial: where devices are located within the AOI, on each day / hour (heatmap)
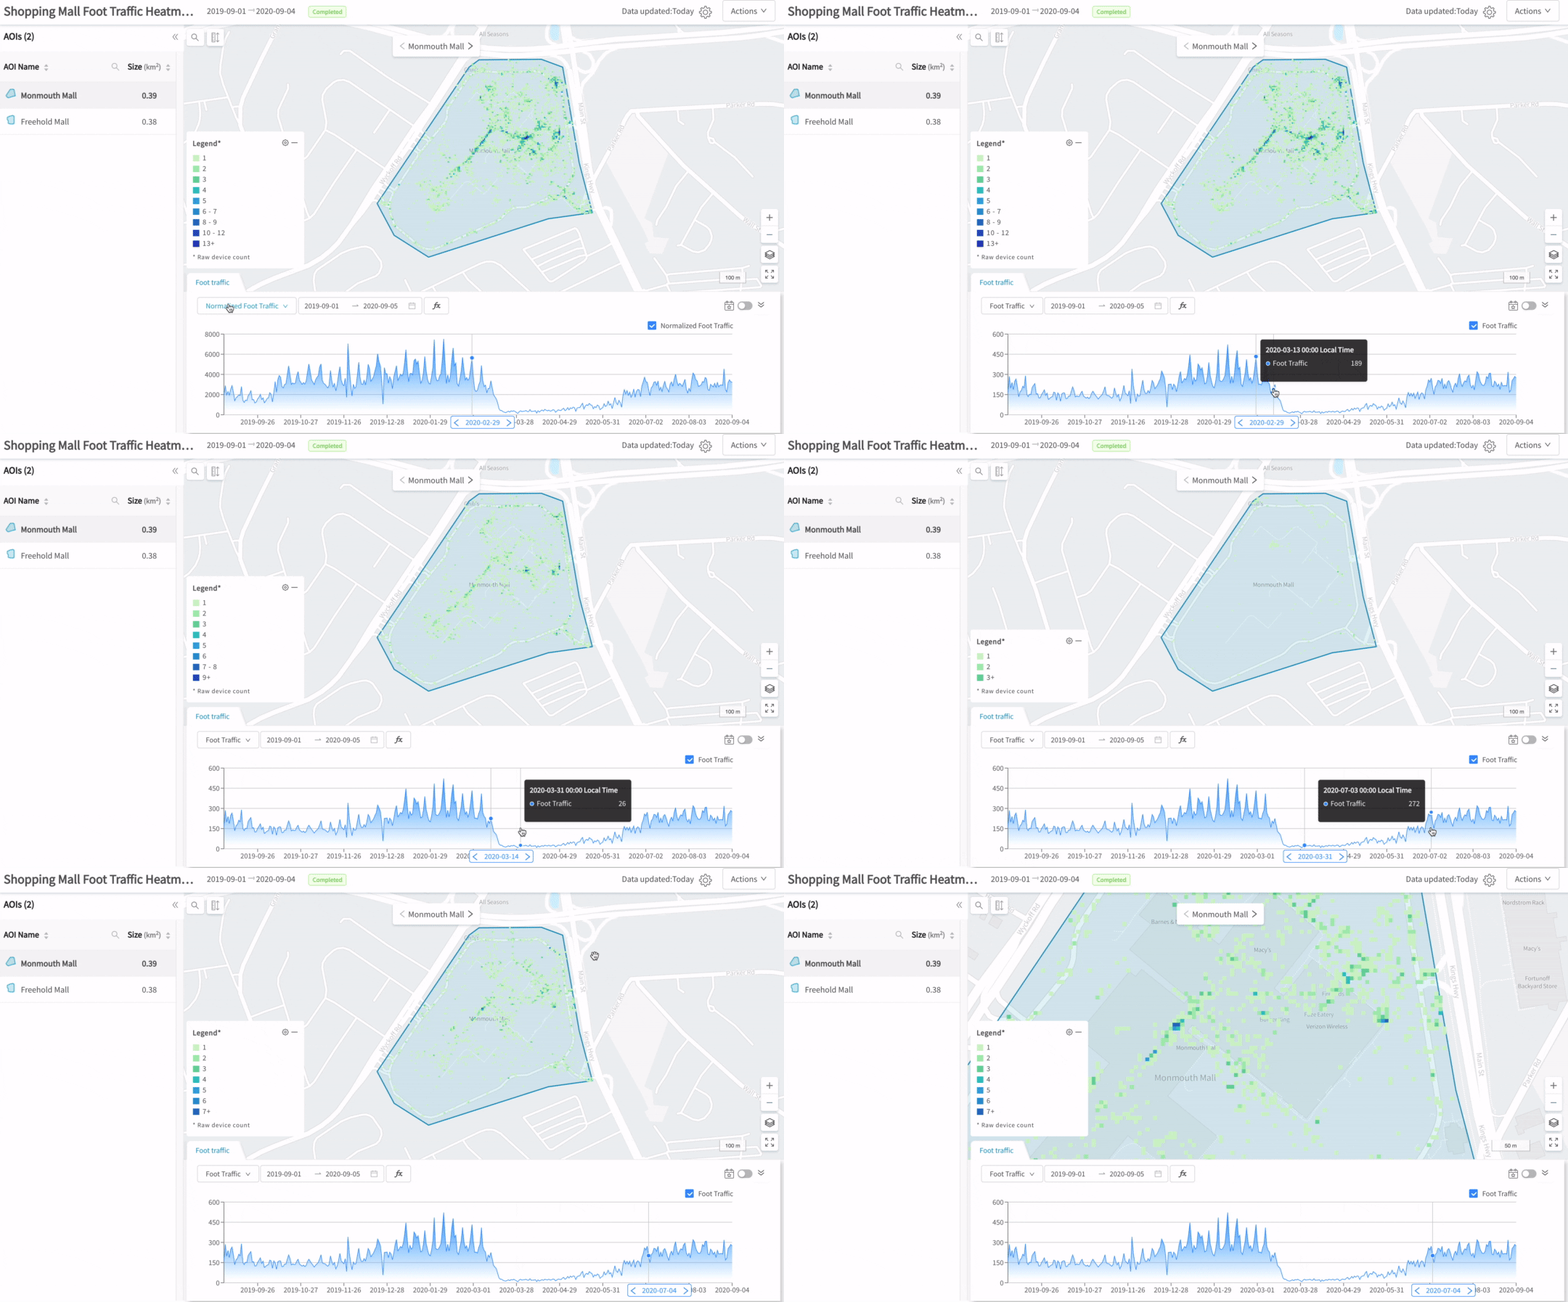
Navigating between daily heatmaps in a foot traffic time series
Heatmaps come with a legend showing the number of devices seen in each part of the AOI - this corresponds to the raw (non-normalized) "Foot Traffic" time series.
Explore foot traffic results:
- Navigate between AOIs to see their results by clicking on them in the left-hand pane
- View heatmaps for particular dates (or hours, if you have an hourly timeseries) by clicking on data-points within the time series chart
- Visualize & manipulate time series results
- Visualize & manipulate spatial results
Traceability
Under construction
Traceability results visualizations are being developed currently
Land Use
Land use results contain only spatial data:
- Spatial: what are the areas (exact polygon geometries) of each land use class detected within my AOI?
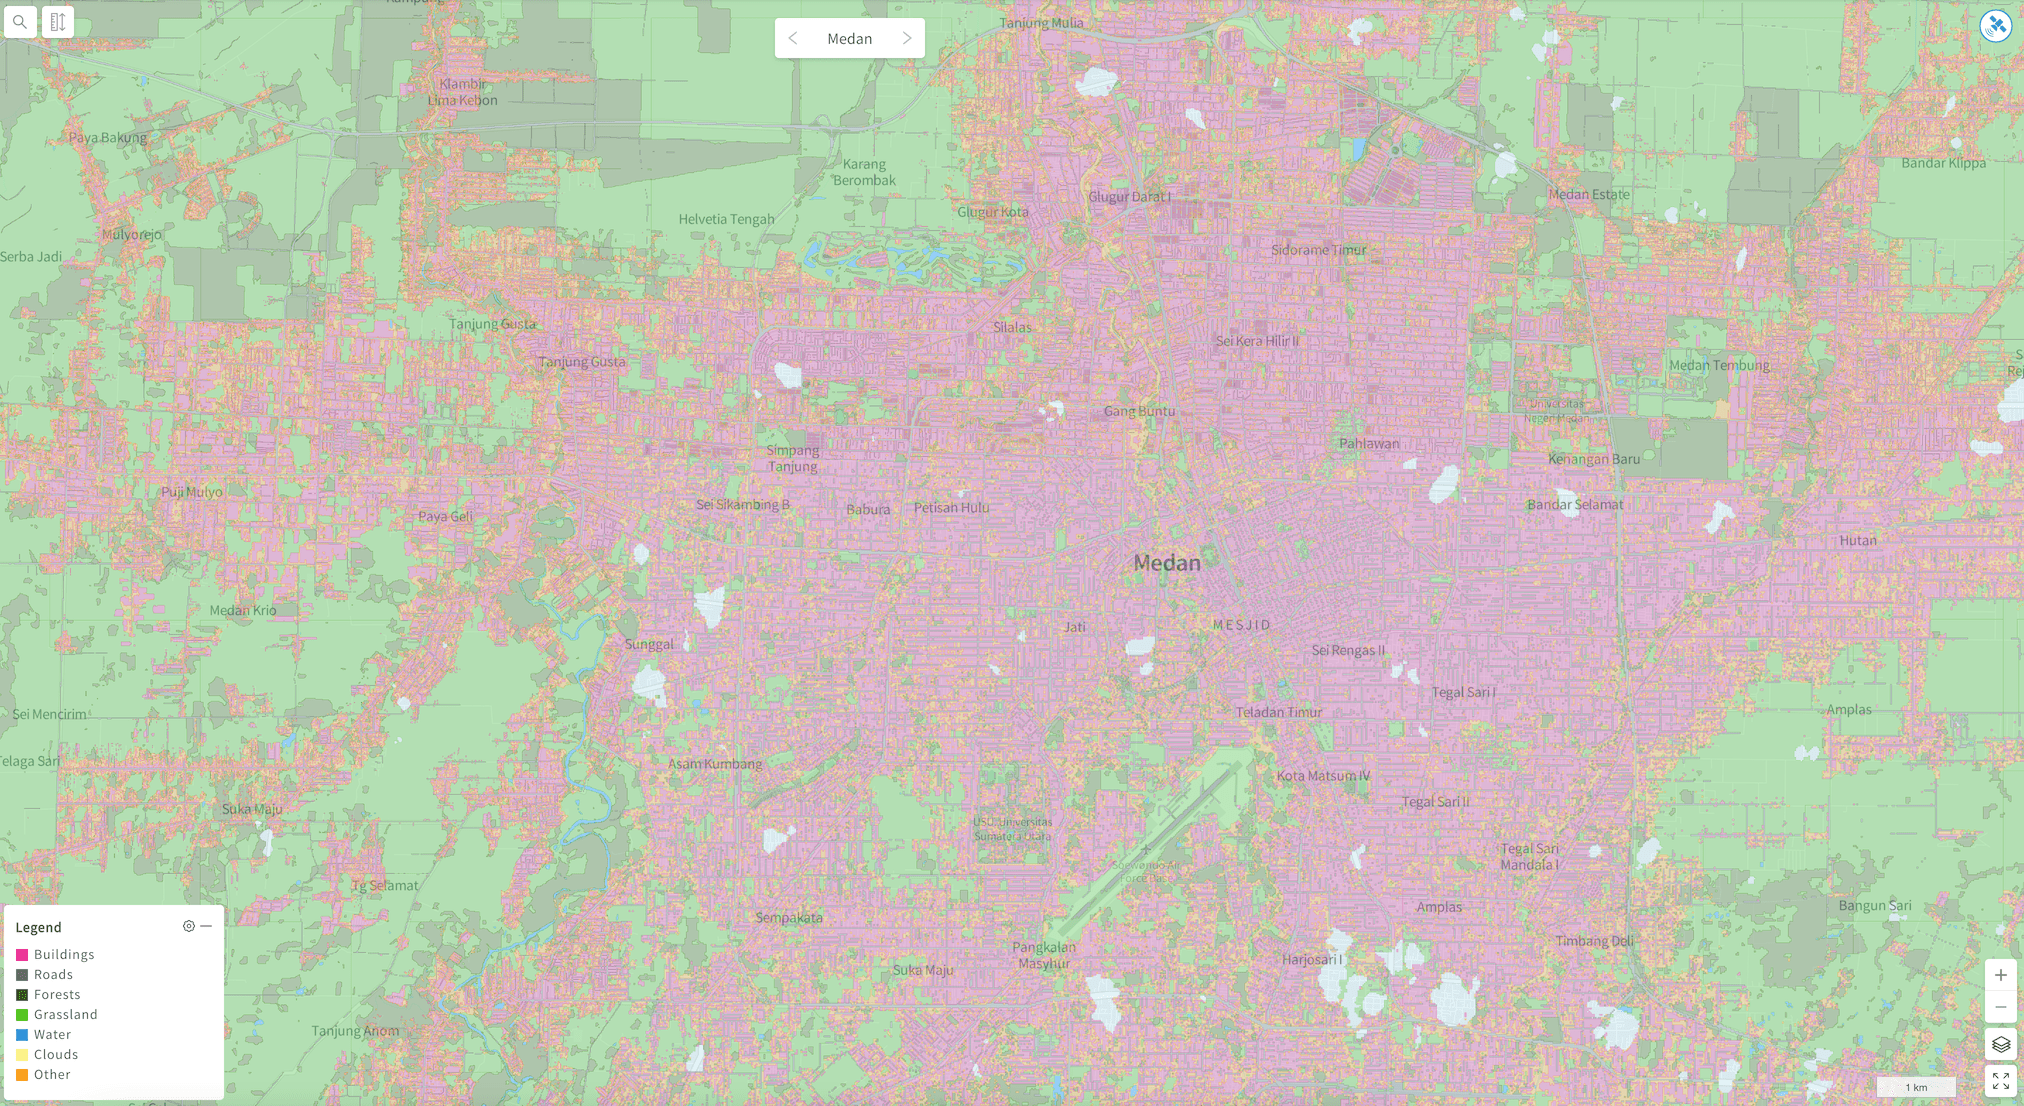
Land Use (1.5m) results - Indonesian city of Medan
Explore land use results:
- Navigate between AOIs to see their results by clicking on them in the left-hand pane
- Visualize & manipulate spatial results
Updated about 3 years ago
Learn more about viewing spatial and time series results